In this analysis we’ll investigate recent trends in the number of impressions and downloads of Buffer’s mobile apps. We’ll focus on three datasets available to us in iTunes Connect that provide the number of impressions the app received by web referrer, app referrer, and campaign.
Summary
- The number of app installs for the iOS and Android apps has declined significantly in the past two years.
- The number of mobile signups is strongly correlated with the number of installs for each app.
- The decrease in the number of mobile signups is probably caused by a decrease in the number of app installs. The next step is to find plausable reasons for the decrease in app installs.
- The total number of app impressions attributed to specific campaigns has decreased significantly since the beginning of 2019.
- This decrease is largely attributed to declines in impressions driven by the campaigns
BufferWebSmartBanner,WebAppSidebar,EID 002 Repost Instagram CTA,Buffer Instagram Connect Device, and campaigns from the Social and Open blogs. - Impressions driven from specific app referrers has decreased significantly since 2018.
- Impressions from web referrers, specifically
ampproject.organdgoogle, have decreased in recent months.
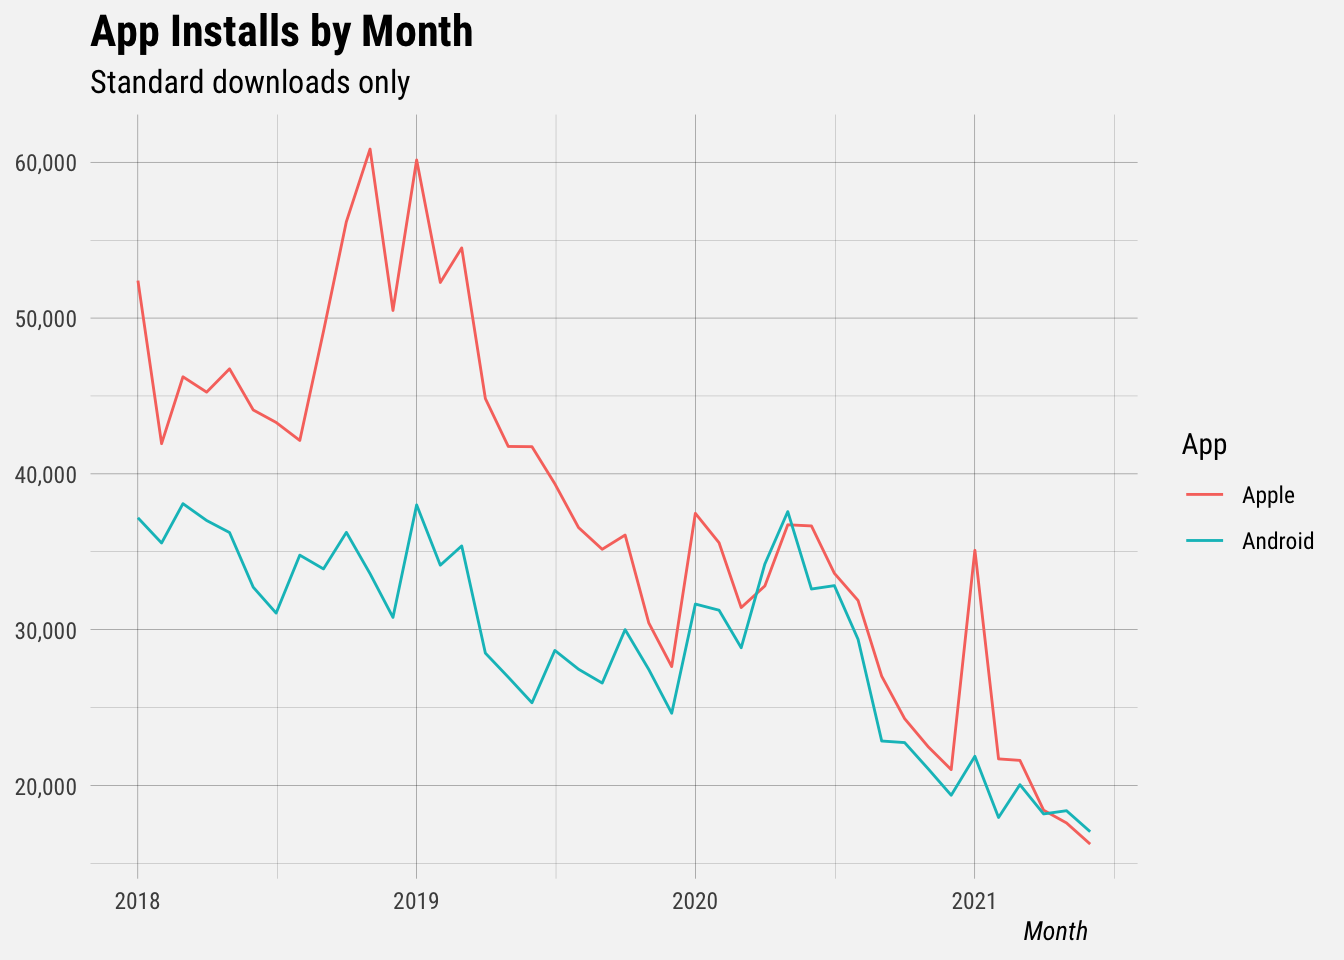
App Installs
Let’s start by looking at the number of app installs for the iOS and Android apps. Both apps have experienced a significant decrease in the number of installs since 2020. The metric used is “standard downloads”, which should exclude educational downloads.
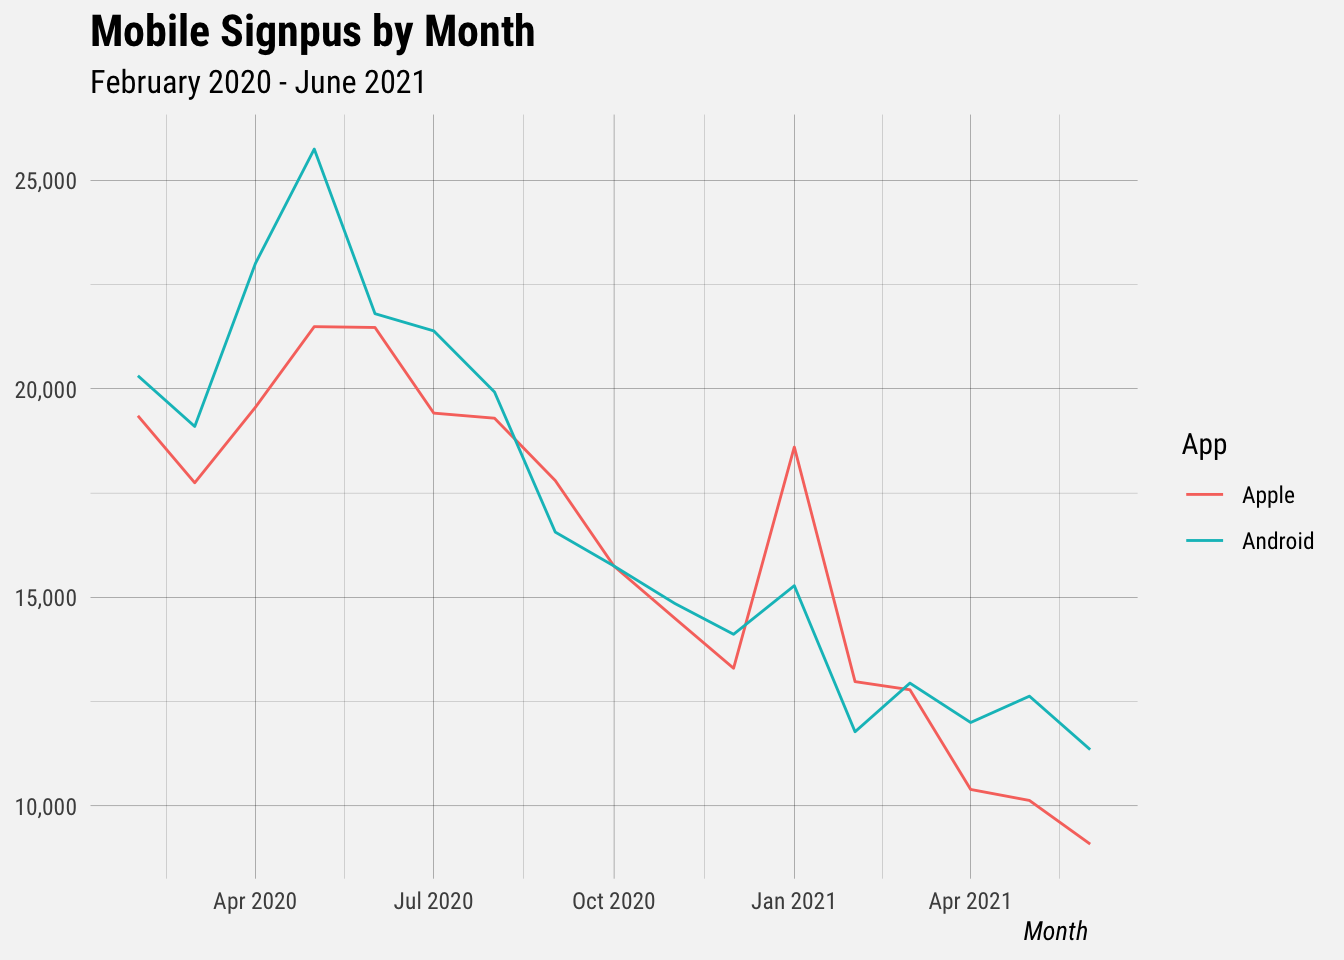
Mobile Signups
Now let’s look at the number of Buffer signups each app has generated. Mixpanel is the source of this data. There is a similar decrease throughout 2020. Mobile signups seem to have decreased by around 50%.
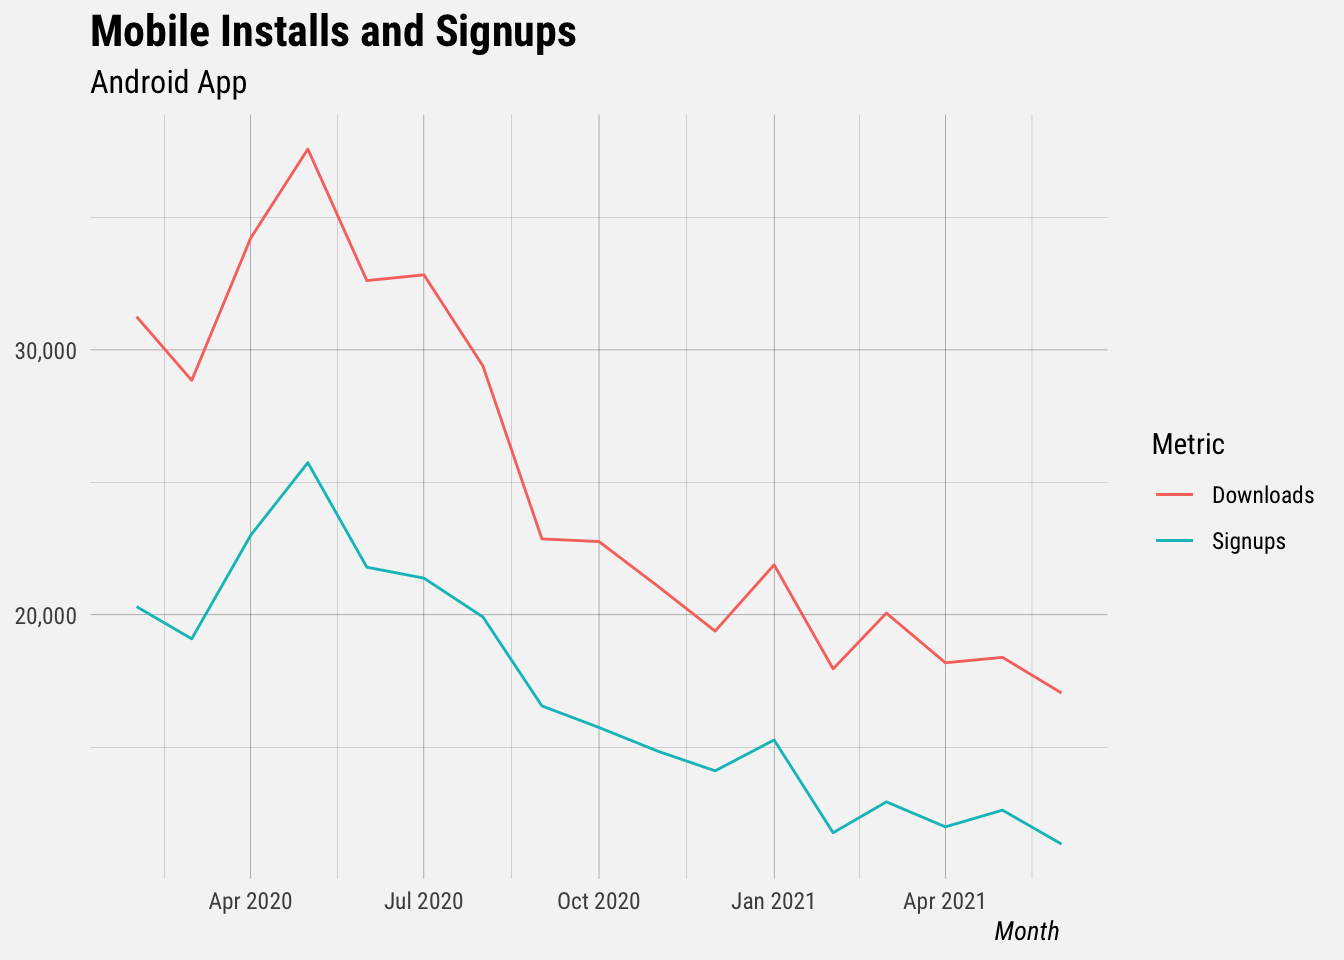
Installs and Signups Ratio
We can see below that there is a very strong correlation between app installs and mobile signups for each app, which makes intuitive sense.
This leads me to the conclusion that the decrease in mobile signups is fundamentally linked to the decrease in app installs.
# select columns
signups <- signups %>%
  select(month, client, signups)

# join data
merged <- downloads %>%
  inner_join(signups, by = c("month" = "month", "store" = "client")) %>%
  select(-start_date)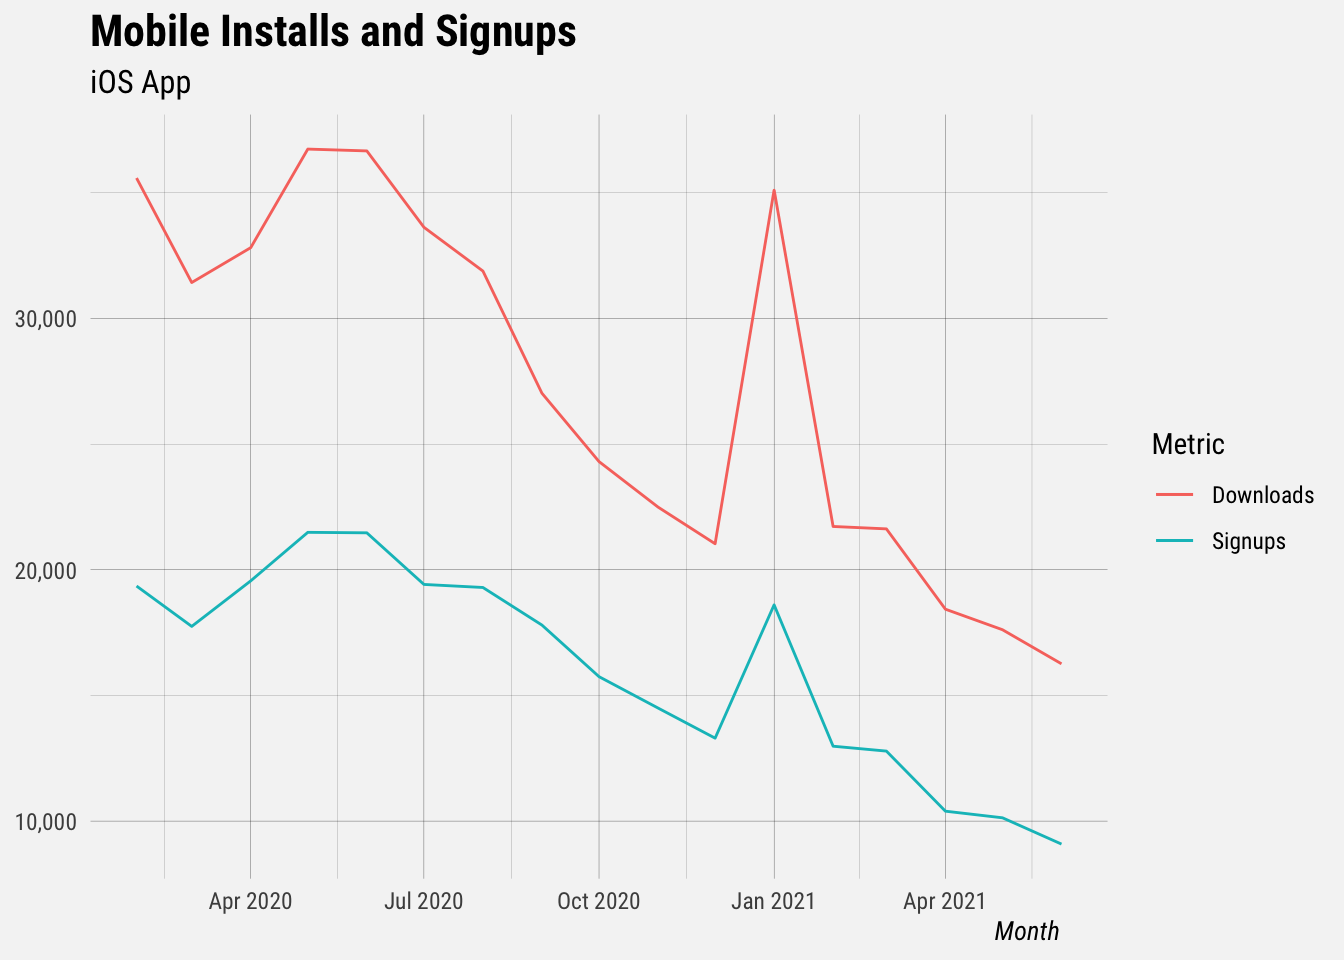
App Store Impressions
Next we’ll look at the number of app store impressions over time. These are the top sources of Apple app store impressions since the beginning of 2018.
# top sources
impressions %>%
  group_by(source_type) %>%
  summarise(unique_impressions = sum(unique_impressions)) %>%
  arrange(desc(unique_impressions))
## # A tibble: 5 x 2
## source_type unique_impressions
## <chr> <int>
## 1 App Store Browse 229499504
## 2 App Store Search 30526806
## 3 Web Referrer 213055
## 4 App Referrer 159243
## 5 Unavailable 574Now let’s viewe the number of impressions over time.
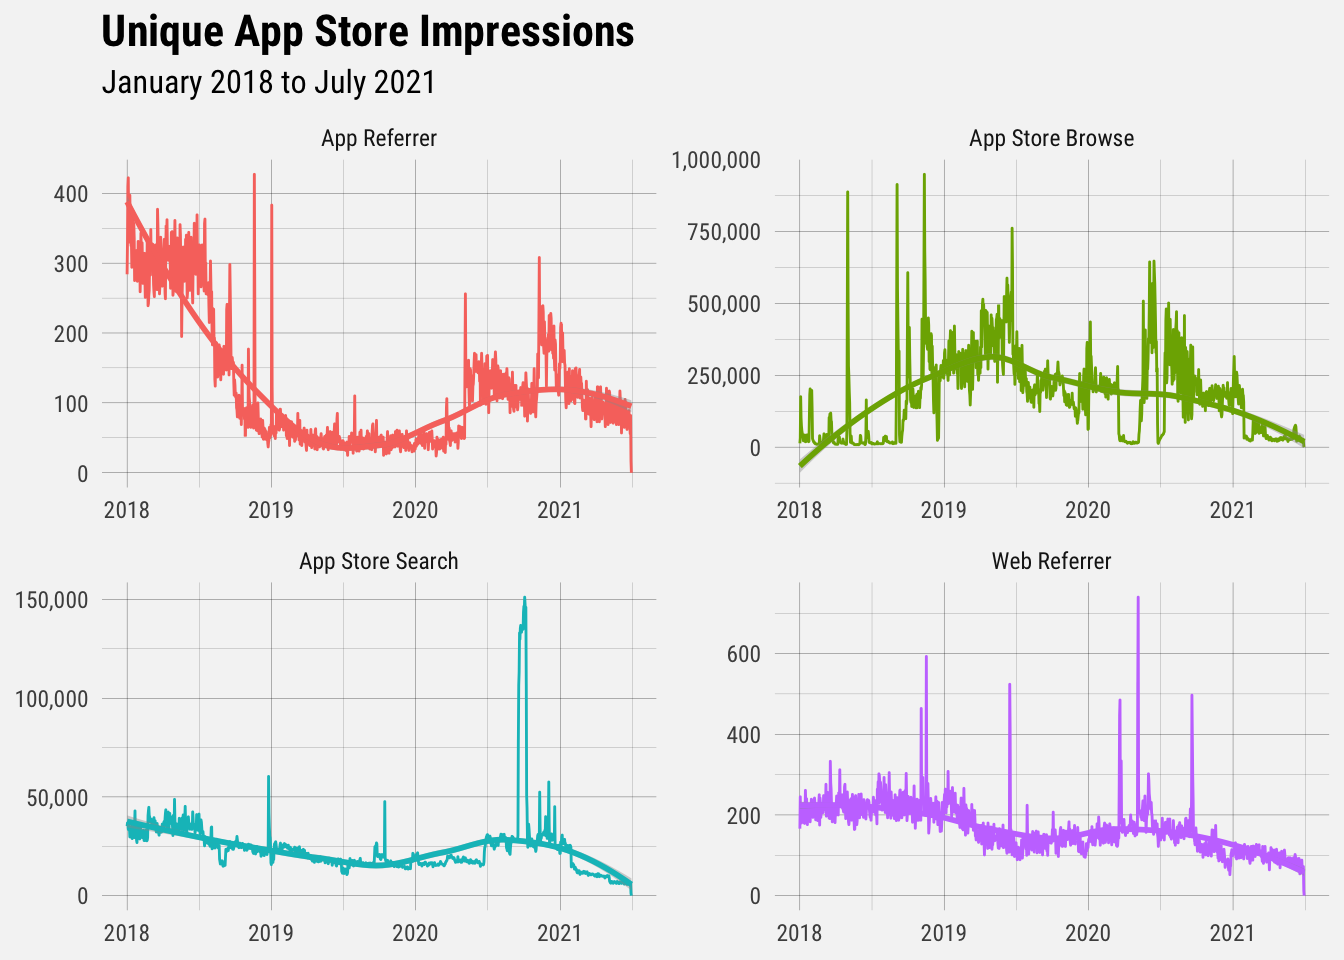
Let’s take a closer look at the “App Store Browse” source.
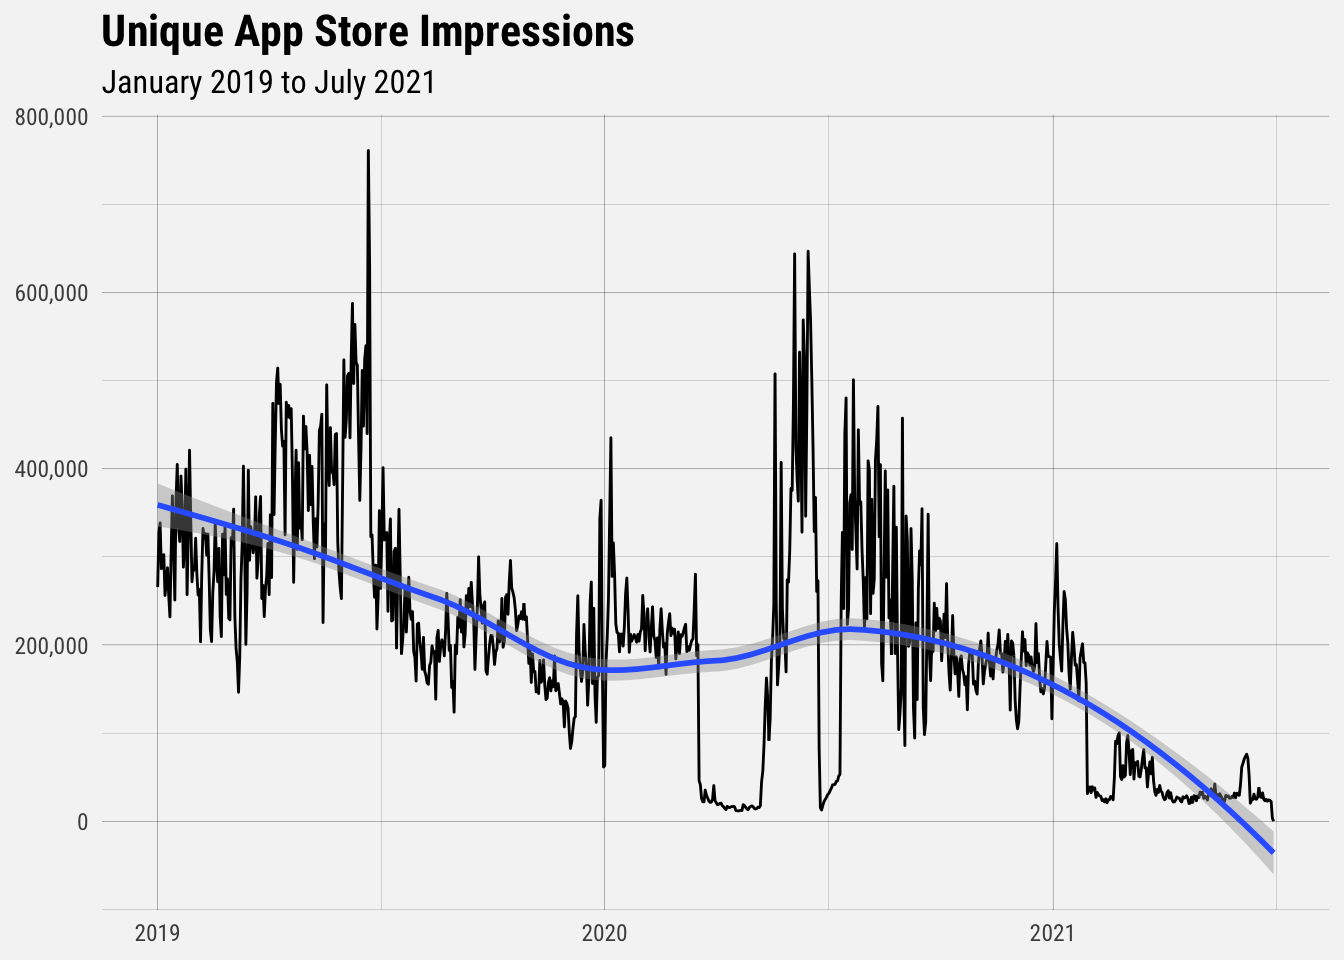
There appears to have been a significant shift in the beginning of 2021. Let’s zoom in a bit more.
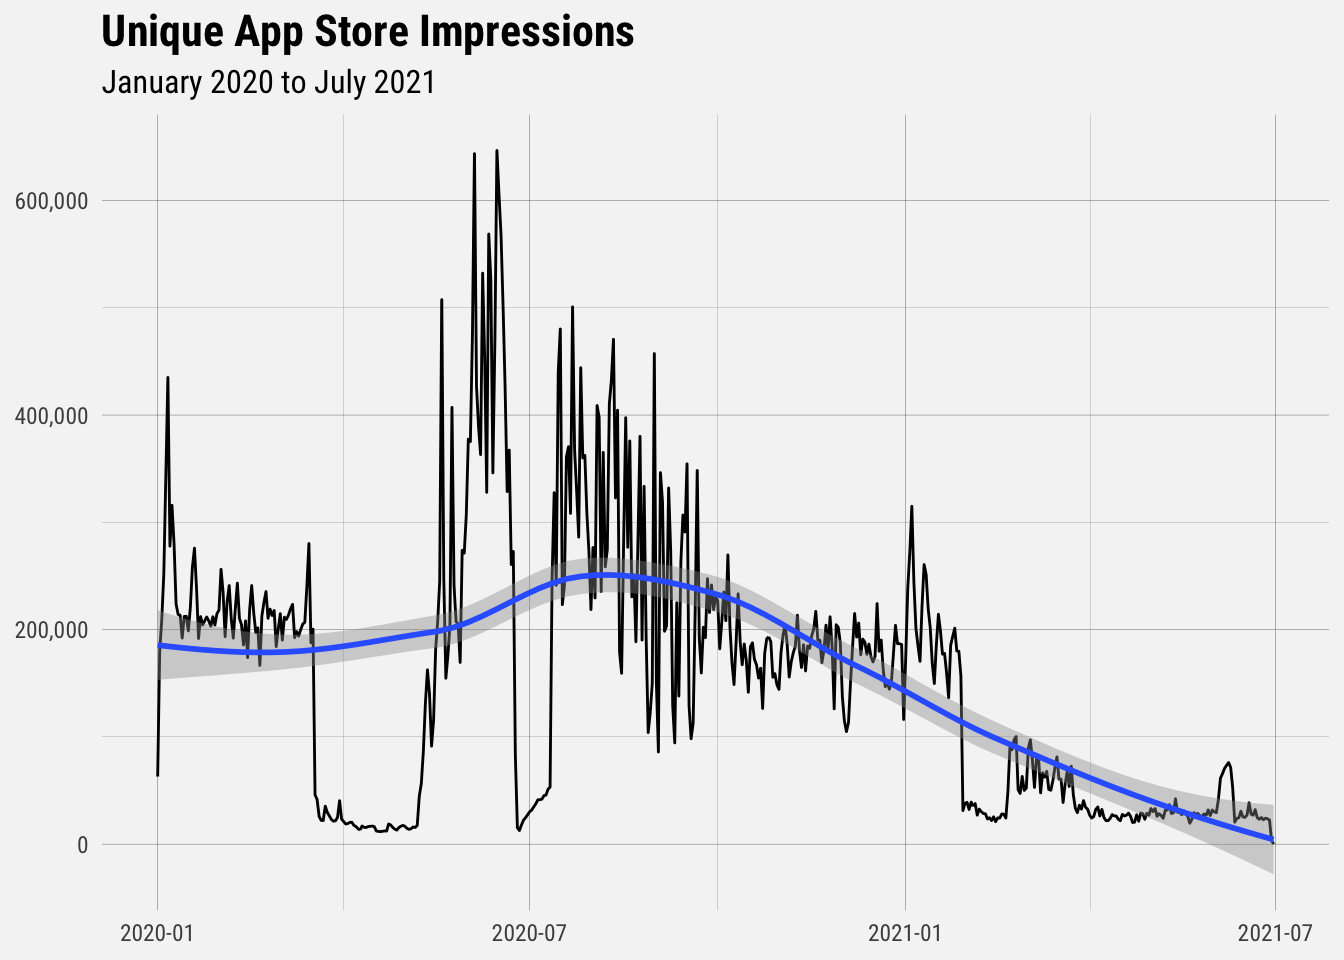
Unique impressions from App Store browsing decreased from 200K+ in 2021 to less than 50K in 2021.
Impressions by Campaign
Next we’ll look at the number of impressions that the iOS has received in the App Store. We’ll start by segmenting impressions pre-defined campaigns. Here’s a glimpse of what the dataset looks like.
# glimpse data
glimpse(campaigns)
## Rows: 402,024
## Columns: 10
## $ app_id <int> 490474324, 490474324, 490474324, 490474324,…
## $ campaign <chr> "Homepage%20Mobile%20Modal", "Homepage Mobi…
## $ date <dttm> 2019-07-04, 2020-03-16, 2019-03-29, 2019-0…
## $ platform_version <chr> "iOS 11.4", "iOS 11.4", "iOS 11.4", "iOS 11…
## $ `_fivetran_synced` <dttm> 2021-06-29 11:12:35, 2021-06-29 11:12:35, …
## $ impressions <int> 0, 0, 0, 0, 0, 0, 0, 0, 0, 0, 0, 0, 0, 0, 0…
## $ impressions_unique_device <int> 0, 0, 0, 0, 0, 0, 0, 0, 0, 0, 0, 0, 0, 0, 0…
## $ meets_threshold <lgl> TRUE, TRUE, TRUE, TRUE, TRUE, TRUE, TRUE, T…
## $ page_views <int> 0, 0, 0, 0, 0, 0, 0, 0, 0, 0, 0, 0, 0, 0, 0…
## $ page_views_unique_device <int> 0, 0, 0, 0, 0, 0, 0, 0, 0, 0, 0, 0, 0, 0, 0…Let’s identify the campaigns that have generated the most impressions over time.
# find top campaings
campaigns %>%
  group_by(campaign) %>%
  summarise(total_impressions = sum(impressions),
            total_unique_impressoins = sum(impressions_unique_device)) %>%
  arrange(desc(total_impressions))
## # A tibble: 19 x 3
## campaign total_impressions total_unique_impressoi…
## <chr> <int> <int>
## 1 BufferWebSmartBanner 142492 115578
## 2 EID 002 Repost Instagram CTA 30141 25910
## 3 Homepage Mobile Modal 16842 13286
## 4 Buffer Instagram Connect Device 11976 7883
## 5 BufferBlogSocial 8523 5536
## 6 Web App Sidebar 4067 2973
## 7 BufferBlogOpen 2954 2075
## 8 EID%20002%20Repost%20Instagram%20C… 1927 1765
## 9 EID 002 Increase Instagram Reach C… 1797 1464
## 10 Free Instagram Tools 1634 1195
## 11 Buffer%20Instagram%20Connect%20Dev… 477 397
## 12 Web%20App%20Sidebar 279 263
## 13 Buffer Instagram Connect Device Ba… 228 170
## 14 Free%20Instagram%20Tools 156 131
## 15 Email Newsletter October 132 118
## 16 EID 005 Buffer mobile apps blog po… 77 51
## 17 Homepage%20Mobile%20Modal 36 29
## 18 EID 002 How to Use Instagram CTA 35 32
## 19 BufferBlogOverflow 13 8It looks like there’s a long-ish tail of campaigns that didn’t result in many impressions. We can group these together into an “other” category. We’ll also rename the “EID%20002%20Repost%20Instagram%20CTA” campaign to “EID 002 Repost Instagram CTA”.
# rename campaigns
campaigns <- campaigns %>%
  mutate(campaign = gsub("EID%20002%20Repost%20Instagram%20CTA",
                         "EID 002 Repost Instagram CTA",
                         campaign)) %>%
  mutate(campaign = gsub("Buffer%20Instagram%20Connect%20Device",
                         "Buffer Instagram Connect Device",
                         campaign)) %>%
  mutate(campaign = gsub("Web%20App%20Sidebar",
                         "Web App Sidebar",
                         campaign))

# group campaigns with less than 2000 impressions
campaigns_grouped <- campaigns %>%
  group_by(campaign) %>%
  mutate(campaign_new = ifelse(sum(impressions) > 2000, campaign, "Other")) %>%
  ungroup()
Let’s view the top performing campaigns again.
# view top campaigns
campaigns_grouped %>%
  group_by(campaign_new) %>%
  summarise(total_impressions = sum(impressions),
            total_unique_impressoins = sum(impressions_unique_device)) %>%
  arrange(desc(total_impressions))
## # A tibble: 8 x 3
## campaign_new total_impressions total_unique_impressoins
## <chr> <int> <int>
## 1 BufferWebSmartBanner 142492 115578
## 2 EID 002 Repost Instagram CTA 32068 27675
## 3 Homepage Mobile Modal 16842 13286
## 4 Buffer Instagram Connect Device 12453 8280
## 5 BufferBlogSocial 8523 5536
## 6 Web App Sidebar 4346 3236
## 7 Other 4108 3198
## 8 BufferBlogOpen 2954 2075Before we analyze the trends in each specific campaign, let’s look at the performance of all campaigns combined over time.
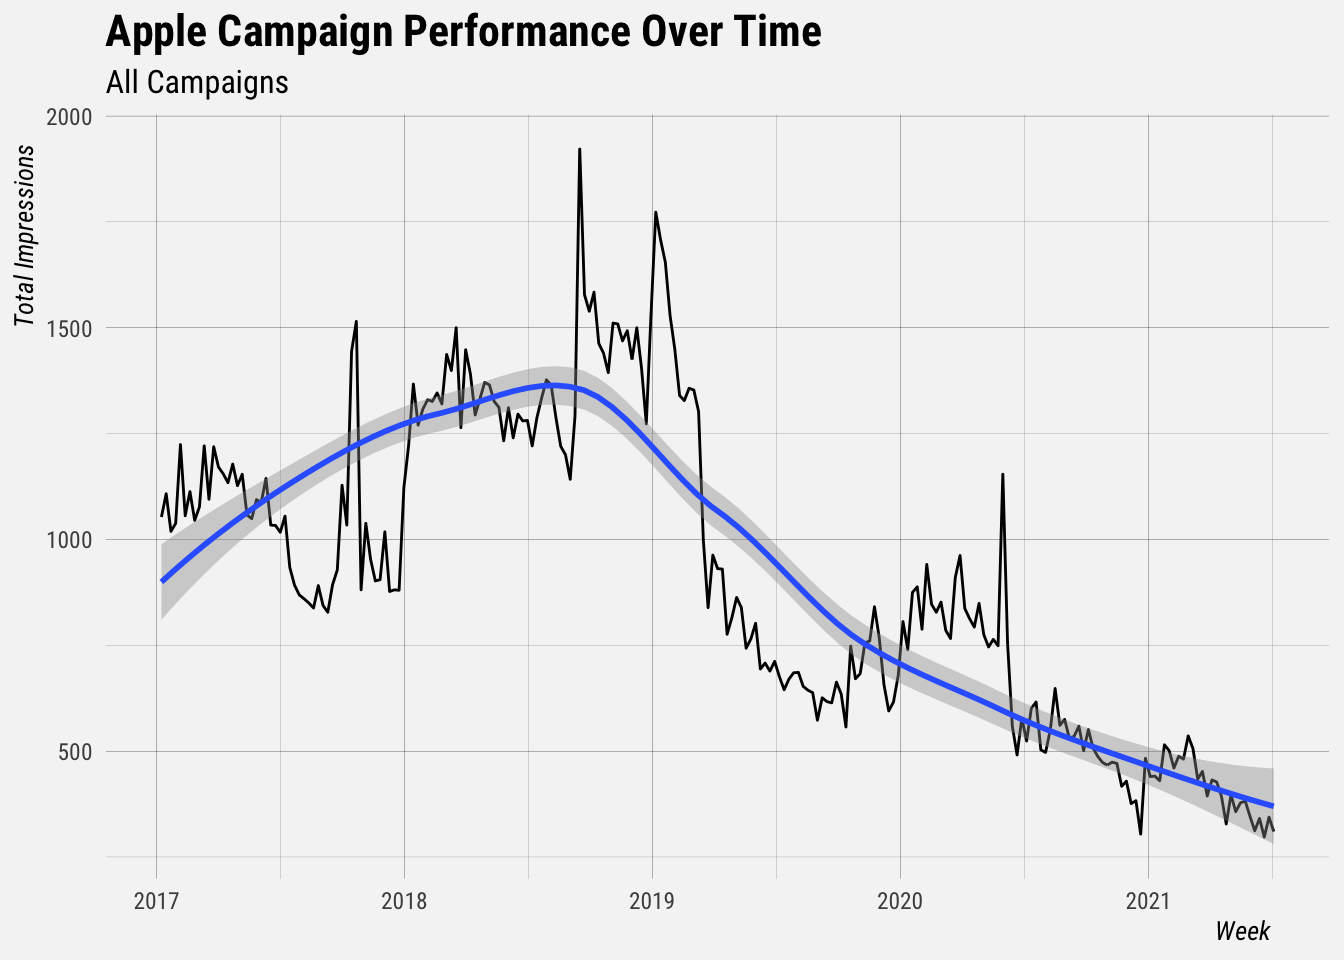
We can see that impressions from campaigns has been declining since early 2019. Let’s break this down by campaign.
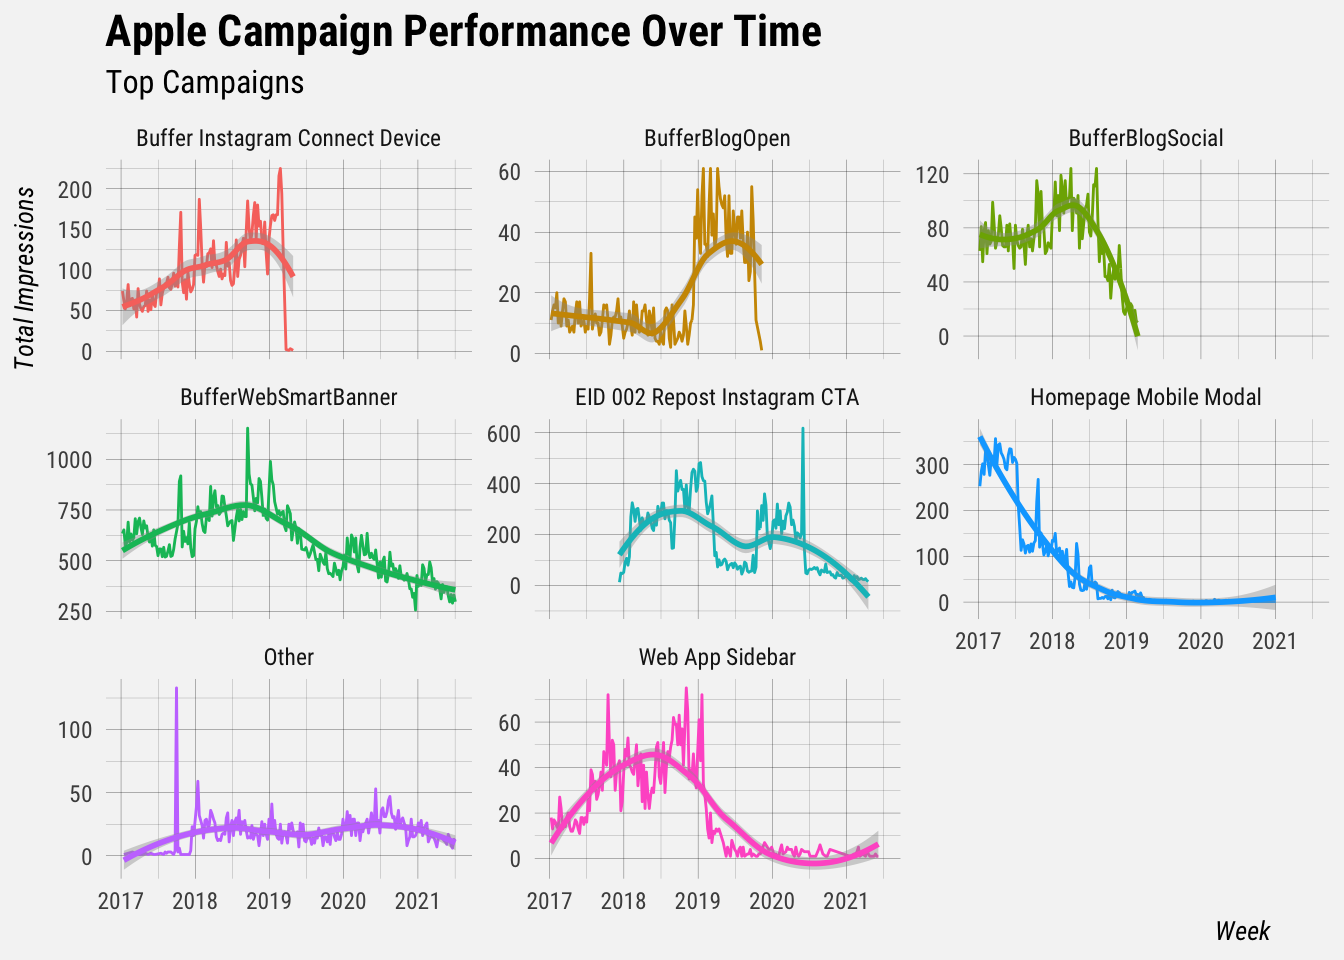
Here we can see that impressions from all of Buffer’s top campaigns have been declining.The top two campaigns, BufferWebSmartBanner and EID 002..., have both seen very significant declines in the number of impressions they generate.
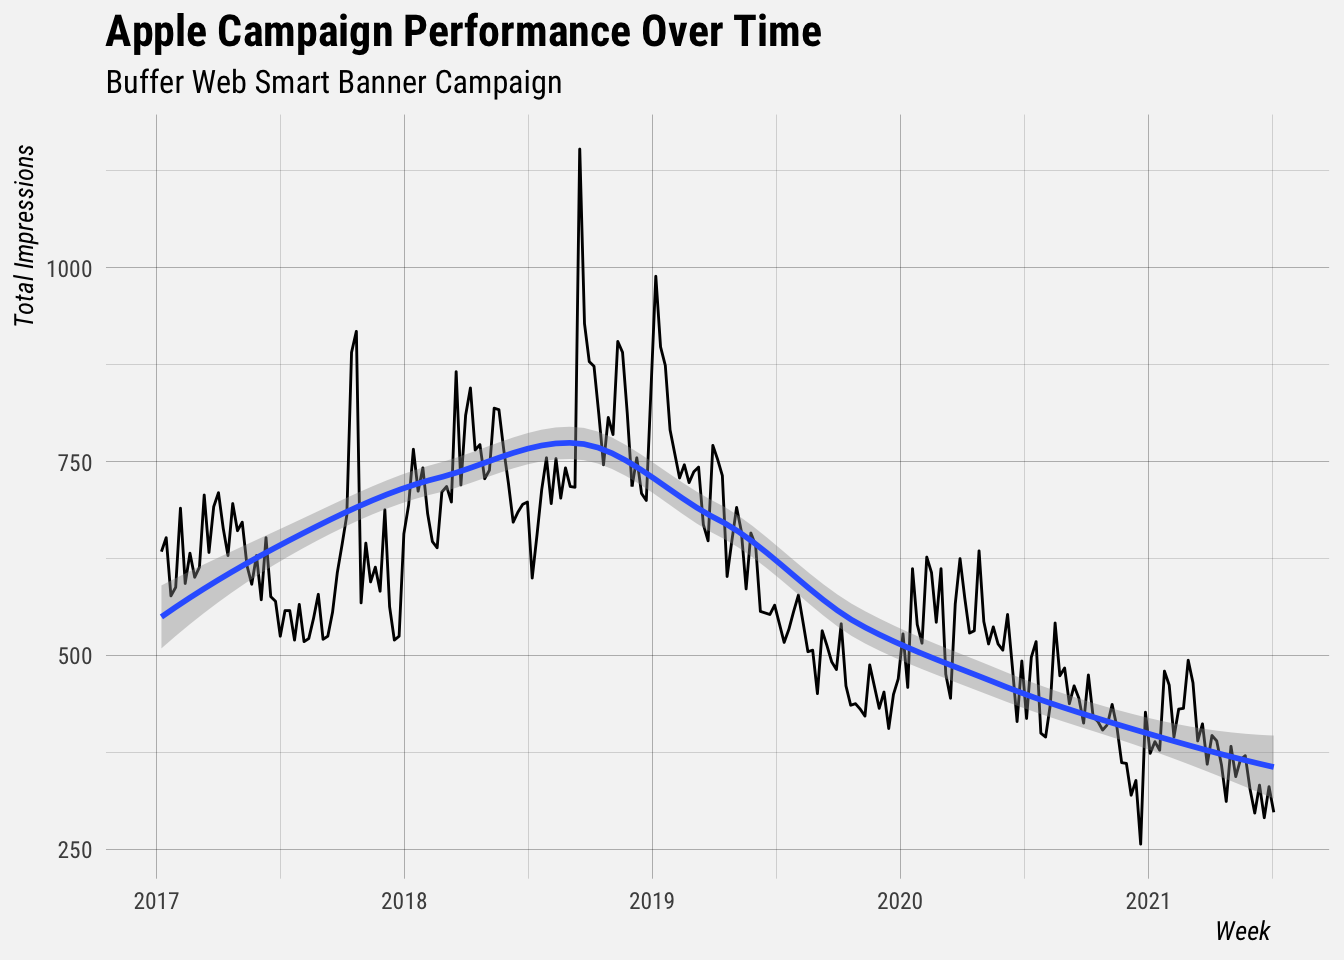
The BufferWebSmartBanner campaign was generating over 750 impressions per week in 2018, but the number of impressions attributed to this campaign in recent weeks has dropped to below 300.
Impressions by App Referrer
We’ll use the same approach to analyze how impresions have changed over time for each app referrer.
# glimpse data
glimpse(referrers)
## Rows: 613,629
## Columns: 10
## $ app_id <int> 1483951350, 1483951350, 1483951350, 1483951…
## $ app_referrer <chr> "Google", "Google", "Google", "Google", "Go…
## $ date <dttm> 2021-03-01, 2021-02-01, 2021-01-04, 2021-0…
## $ platform_version <chr> "iOS 14.2", "iOS 14.2", "iOS 14.2", "iOS 14…
## $ `_fivetran_synced` <dttm> 2021-06-28 15:36:21, 2021-06-28 15:36:21, …
## $ impressions <int> 0, 0, 0, 0, 0, 0, 0, 0, 0, 0, 0, 0, 0, 0, 0…
## $ impressions_unique_device <int> 0, 0, 0, 0, 0, 0, 0, 0, 0, 0, 0, 0, 0, 0, 0…
## $ meets_threshold <lgl> TRUE, TRUE, TRUE, TRUE, TRUE, TRUE, TRUE, T…
## $ page_views <int> 0, 0, 0, 0, 0, 0, 0, 0, 0, 0, 0, 0, 0, 0, 0…
## $ page_views_unique_device <int> 0, 0, 0, 0, 0, 0, 0, 0, 0, 0, 0, 0, 0, 0, 0…Facebook is the top referrer by a long way. We’ll lump together referrers that have generated less than a total of 500 impressions.
# find top referrers
referrers %>%
  group_by(app_referrer) %>%
  summarise(total_impressions = sum(impressions),
            total_unique_impressoins = sum(impressions_unique_device)) %>%
  arrange(desc(total_impressions))
## # A tibble: 53 x 3
## app_referrer total_impressions total_unique_impressoins
## <chr> <int> <int>
## 1 Facebook 239480 228134
## 2 Feedly - Smart News Reader 20962 15982
## 3 Google 14292 12271
## 4 Google Chrome 14247 11725
## 5 Instagram 6139 5920
## 6 Messages 5691 4744
## 7 WhatsApp Messenger 3954 3435
## 8 Buffer: Social Media Tools 3576 3435
## 9 Messenger 1037 788
## 10 LINE 887 709
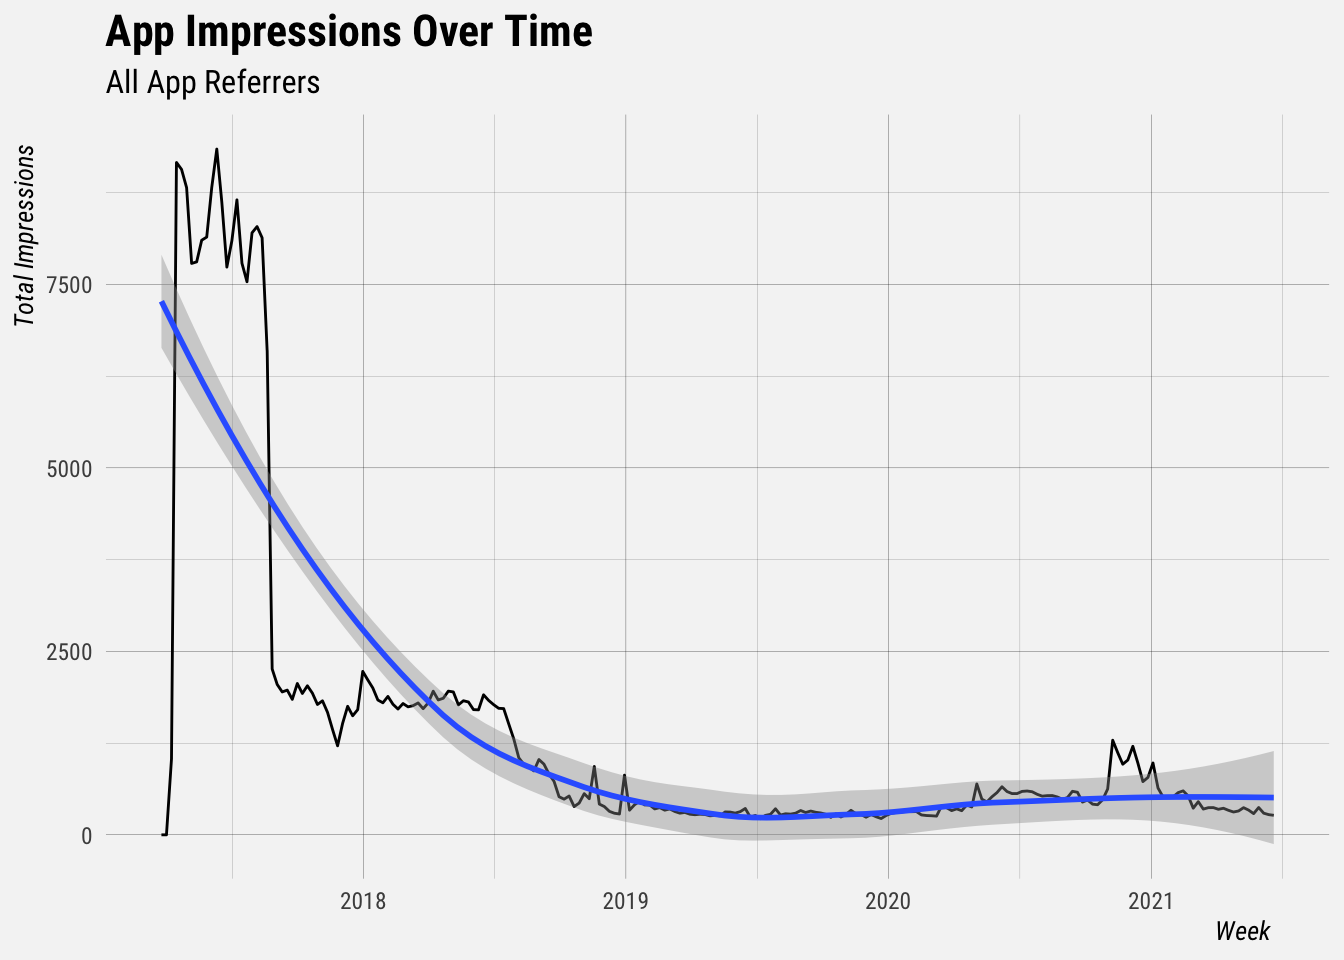
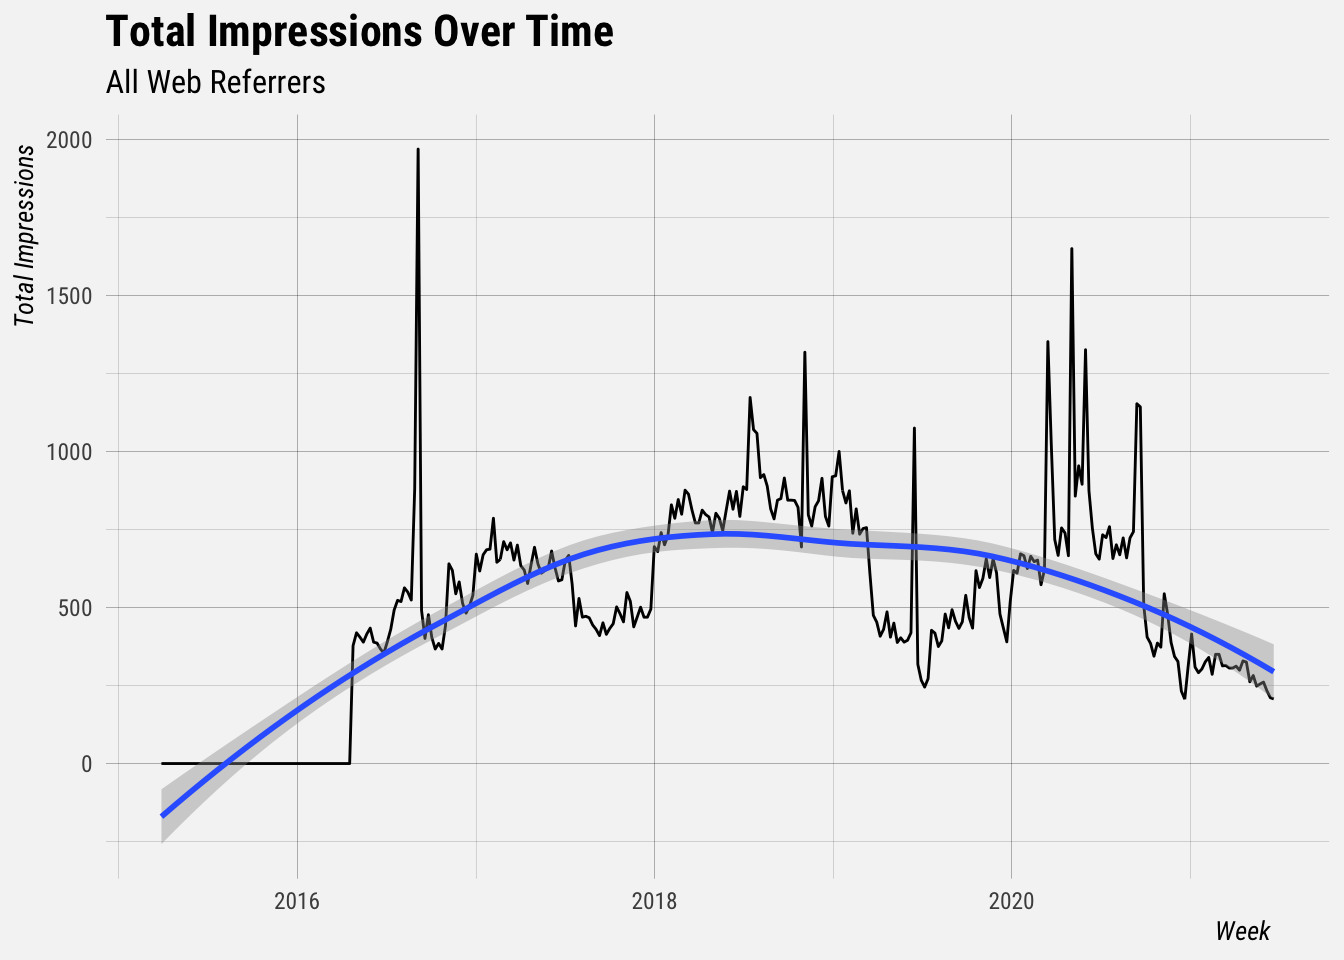
## # … with 43 more rowsBefore we do that, let’s view the total number impressions over time. It looks like there were a lot of impressions in 2017 before a large drop and gradual decline. Let’s break it down by referrer.
# group referrers with less than 500 impressions
referrers_grouped <- referrers %>%
  group_by(app_referrer) %>%
  mutate(referrer_new = ifelse(sum(impressions) > 1000, app_referrer, "Other")) %>%
  ungroup()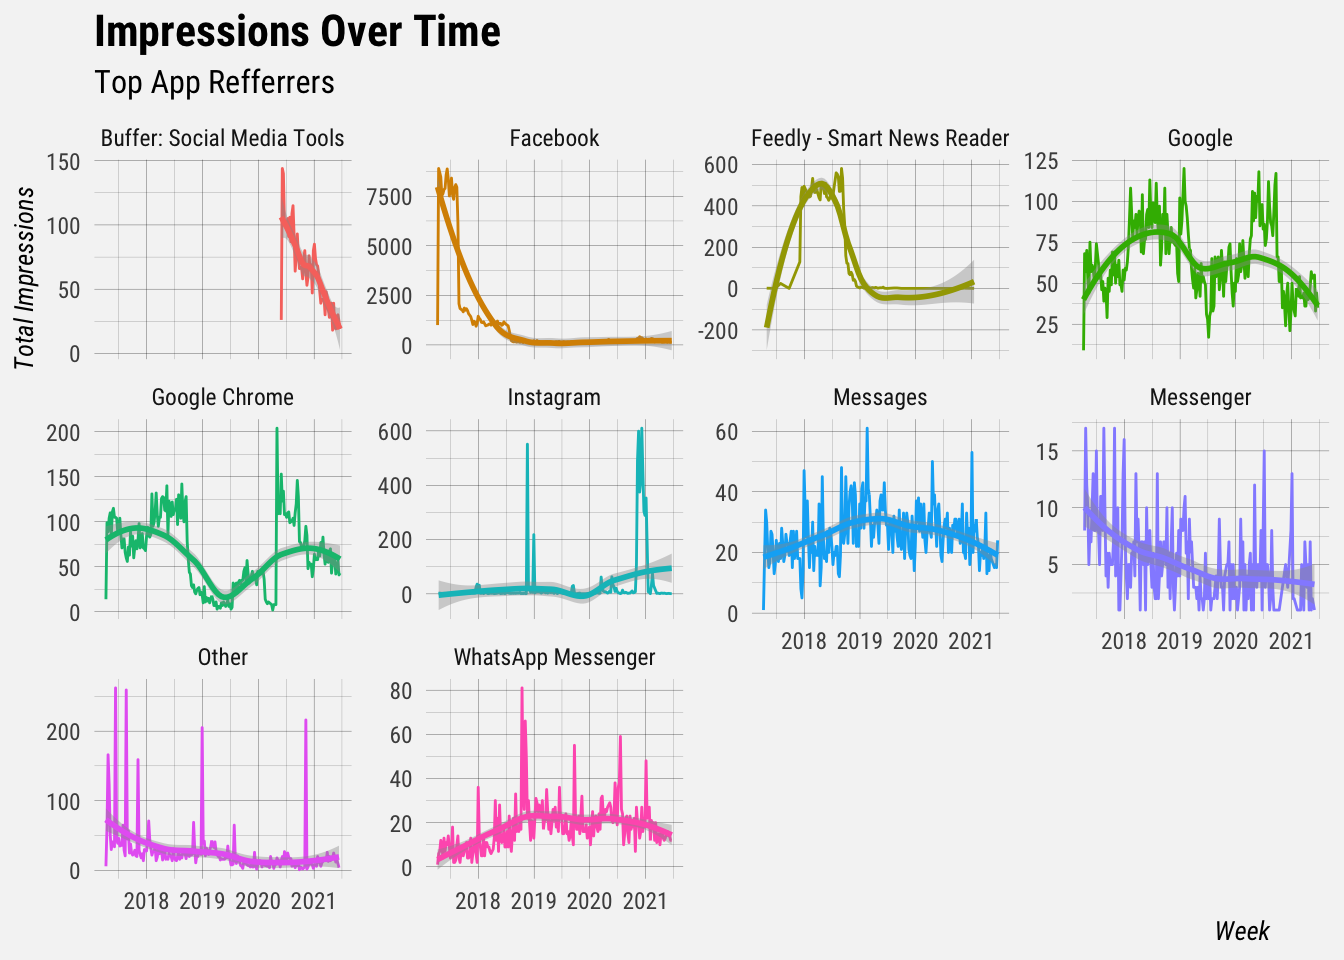
Since Facebook is the biggest referrer by far, let’s take a closer look at it. There was a huge spike and dip in 2017, and another dip in 2018.
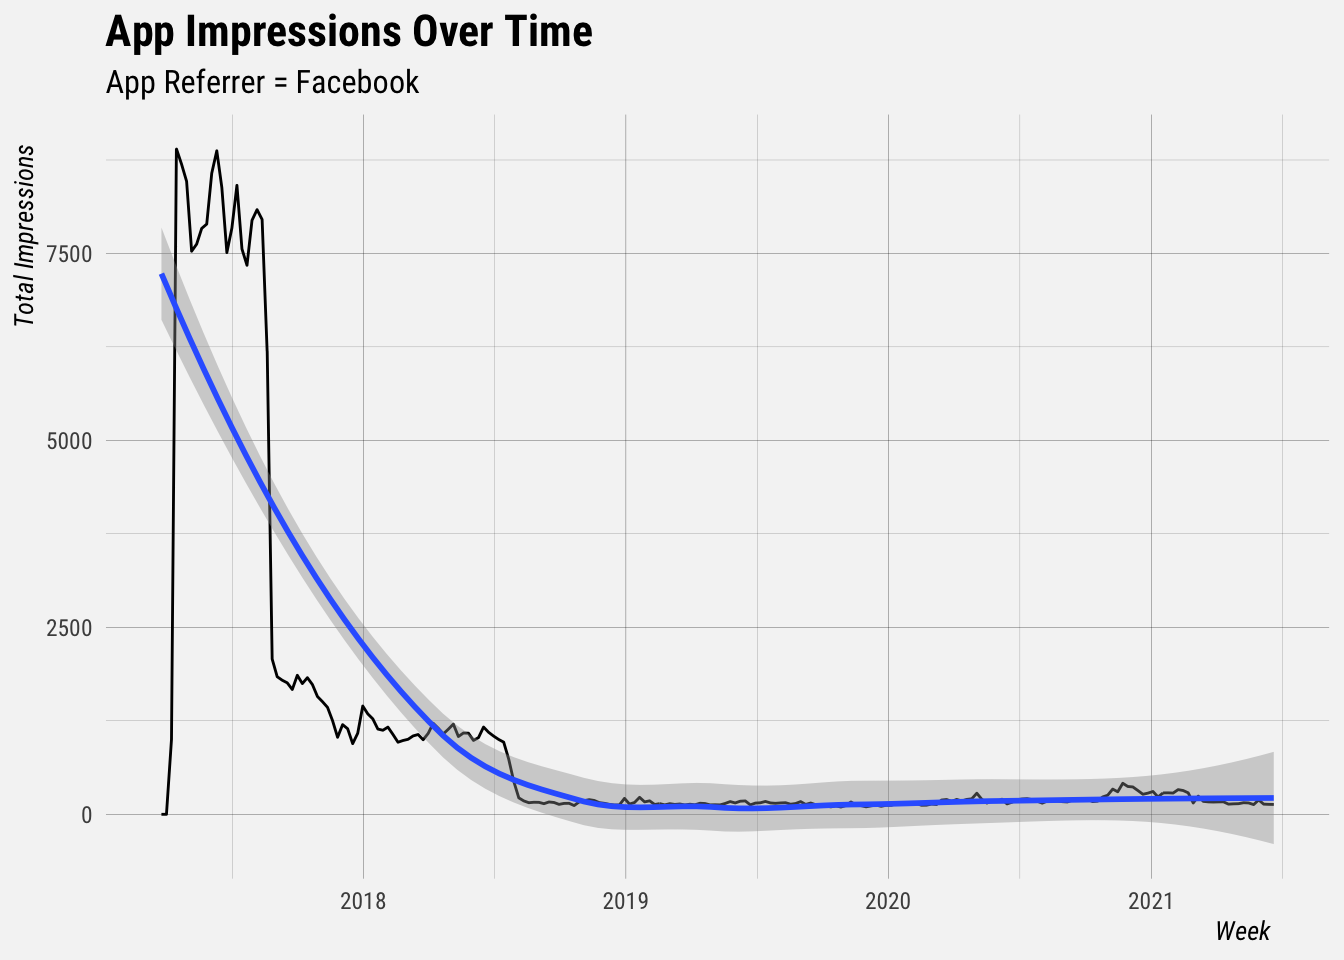
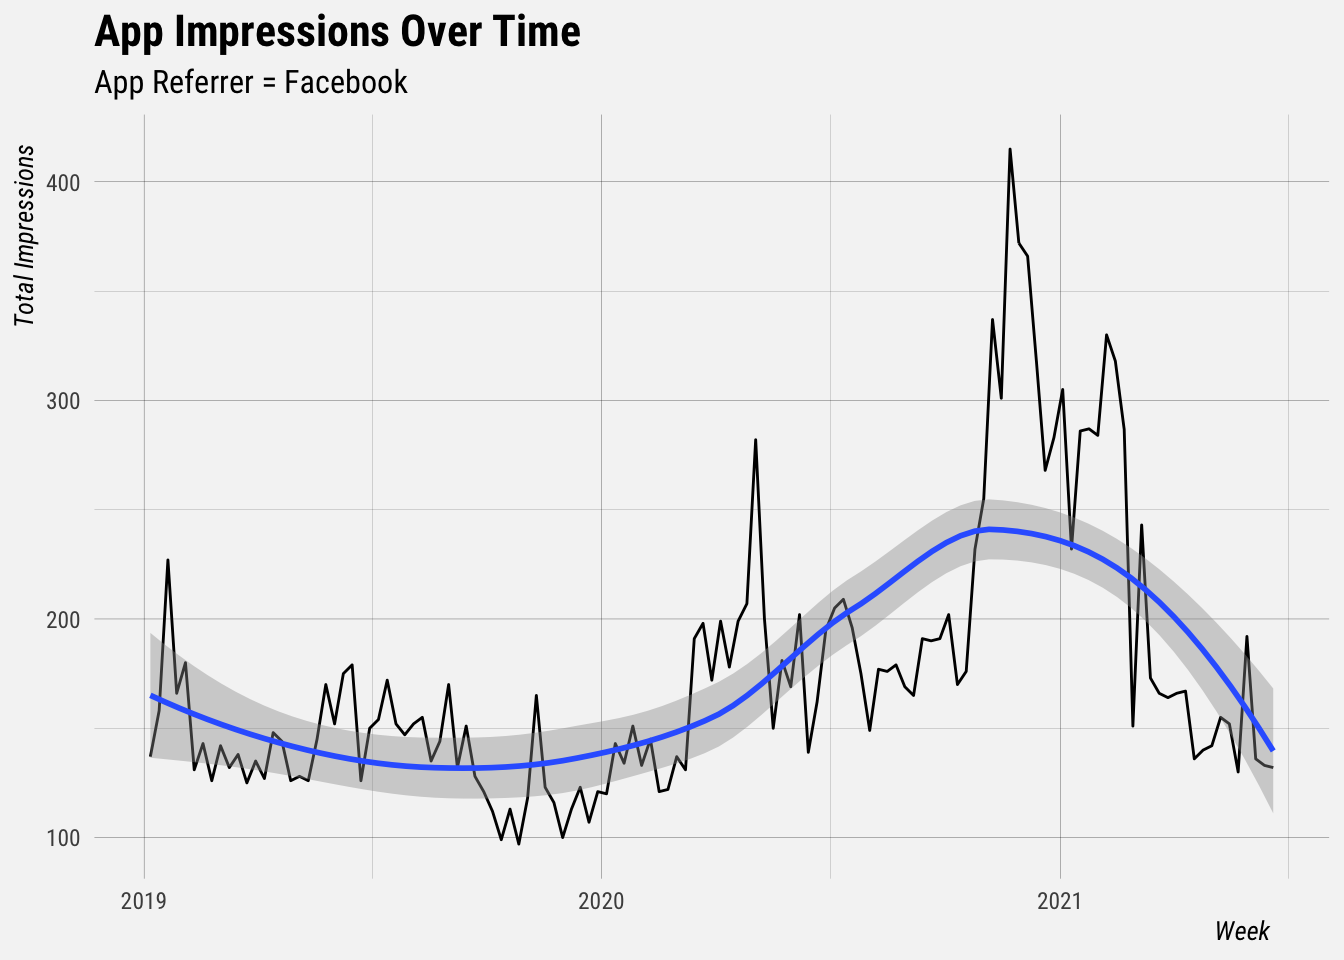
Since January 2019 impressions from Facebook have been relatively stable.
Impressions by Web Referrer
We’ll use the same approach to analyze how impresions have changed over time for each web referrer.
# glimpse data
glimpse(web)
## Rows: 2,401,069
## Columns: 10
## $ app_id <int> 1327777195, 1327777195, 1327777195, 1327777…
## $ date <dttm> 2018-07-12, 2018-07-30, 2018-08-17, 2018-1…
## $ platform_version <chr> "iOS 11.4", "iOS 11.4", "iOS 11.4", "iOS 11…
## $ web_referrer <chr> "buffer.com", "buffer.com", "buffer.com", "…
## $ `_fivetran_synced` <dttm> 2021-06-28 18:58:37, 2021-06-28 18:58:37, …
## $ impressions <int> 0, 0, 0, 0, 0, 0, 0, 0, 0, 0, 0, 0, 0, 0, 0…
## $ impressions_unique_device <int> 0, 0, 0, 0, 0, 0, 0, 0, 0, 0, 0, 0, 0, 0, 0…
## $ meets_threshold <lgl> TRUE, TRUE, TRUE, TRUE, TRUE, TRUE, TRUE, T…
## $ page_views <int> 0, 0, 0, 0, 0, 0, 0, 0, 0, 0, 0, 0, 0, 0, 0…
## $ page_views_unique_device <int> 0, 0, 0, 0, 0, 0, 0, 0, 0, 0, 0, 0, 0, 0, 0…Now let’s look at the top web referrers.
# get top web referrers
web %>%
  group_by(web_referrer) %>%
  summarise(impressions = sum(impressions)) %>%
  arrange(desc(impressions)) %>%
  head(20)
## # A tibble: 20 x 2
## web_referrer impressions
## <chr> <int>
## 1 buffer.com 49532
## 2 ampproject.org 30915
## 3 google.com 30453
## 4 google.co.uk 6930
## 5 gadgethacks.com 3763
## 6 t.co 2880
## 7 bufferapp.com 2861
## 8 google.ca 2613
## 9 google.com.au 2584
## 10 google.co.jp 2528
## 11 youtube.com 2166
## 12 google.fr 2098
## 13 idropnews.com 2001
## 14 google.de 1892
## 15 google.co.in 1642
## 16 google.co.th 1111
## 17 google.it 1075
## 18 google.es 804
## 19 google.nl 734
## 20 google.com.ph 689Let’s group all the google referrers together.
# group google referrers
web <- web %>%
  mutate(grouped = ifelse(str_detect(web_referrer, "google"),
                          "google",
                          web_referrer))
Now let’s show all impressions over time.
Let’s break it down by the top web referrers.
# group referrers with less than 500 impressions
web_grouped <- web %>%
  group_by(grouped) %>%
  mutate(grouped_new = ifelse(sum(impressions) > 2000, grouped, "Other")) %>%
  ungroup()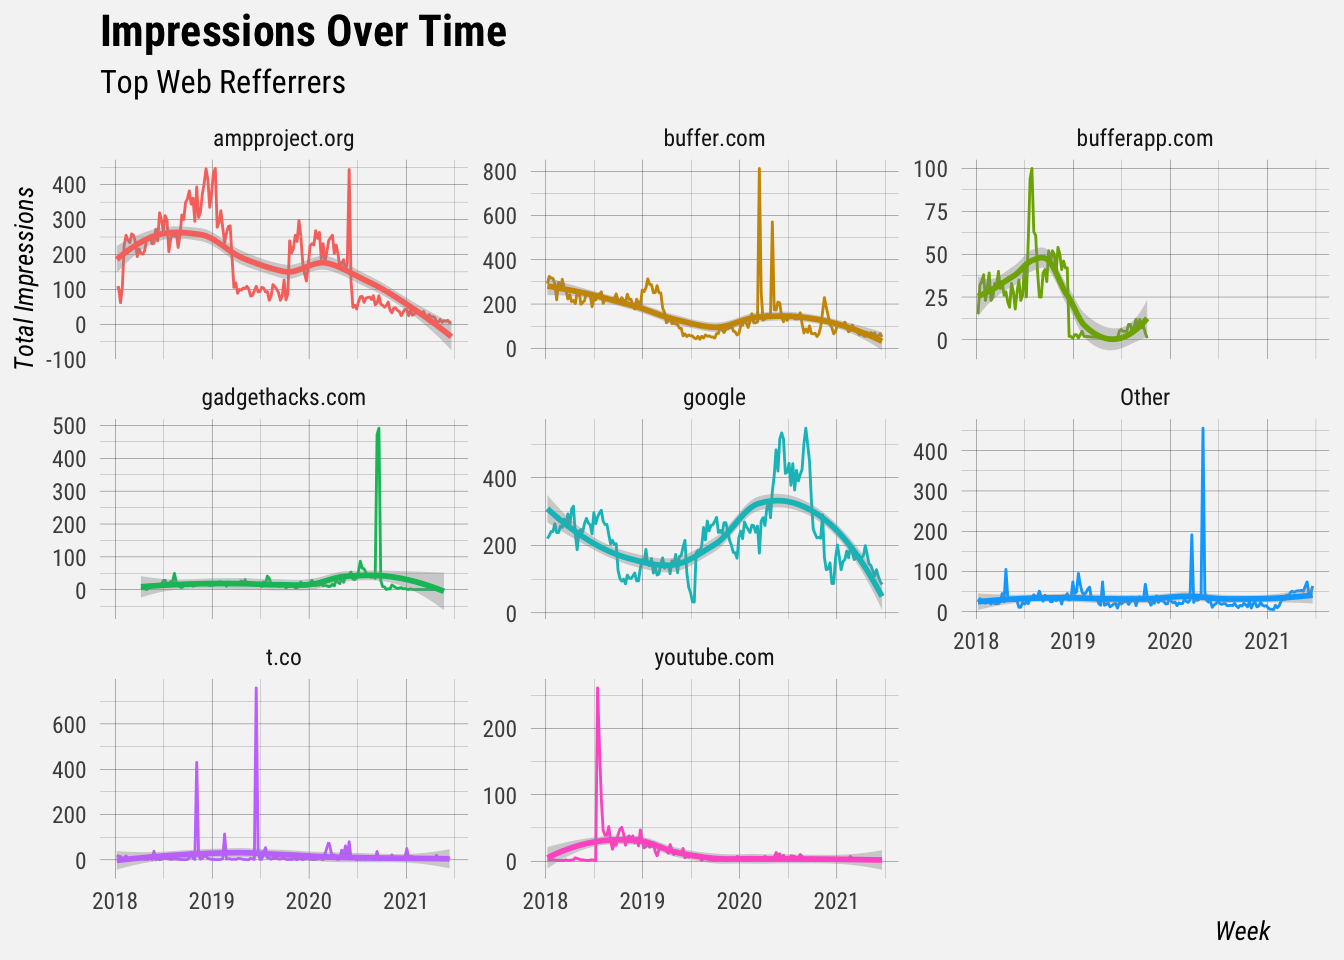
Since google, buffer, and ampproject are the three biggest web refferers, let’s look only at them.
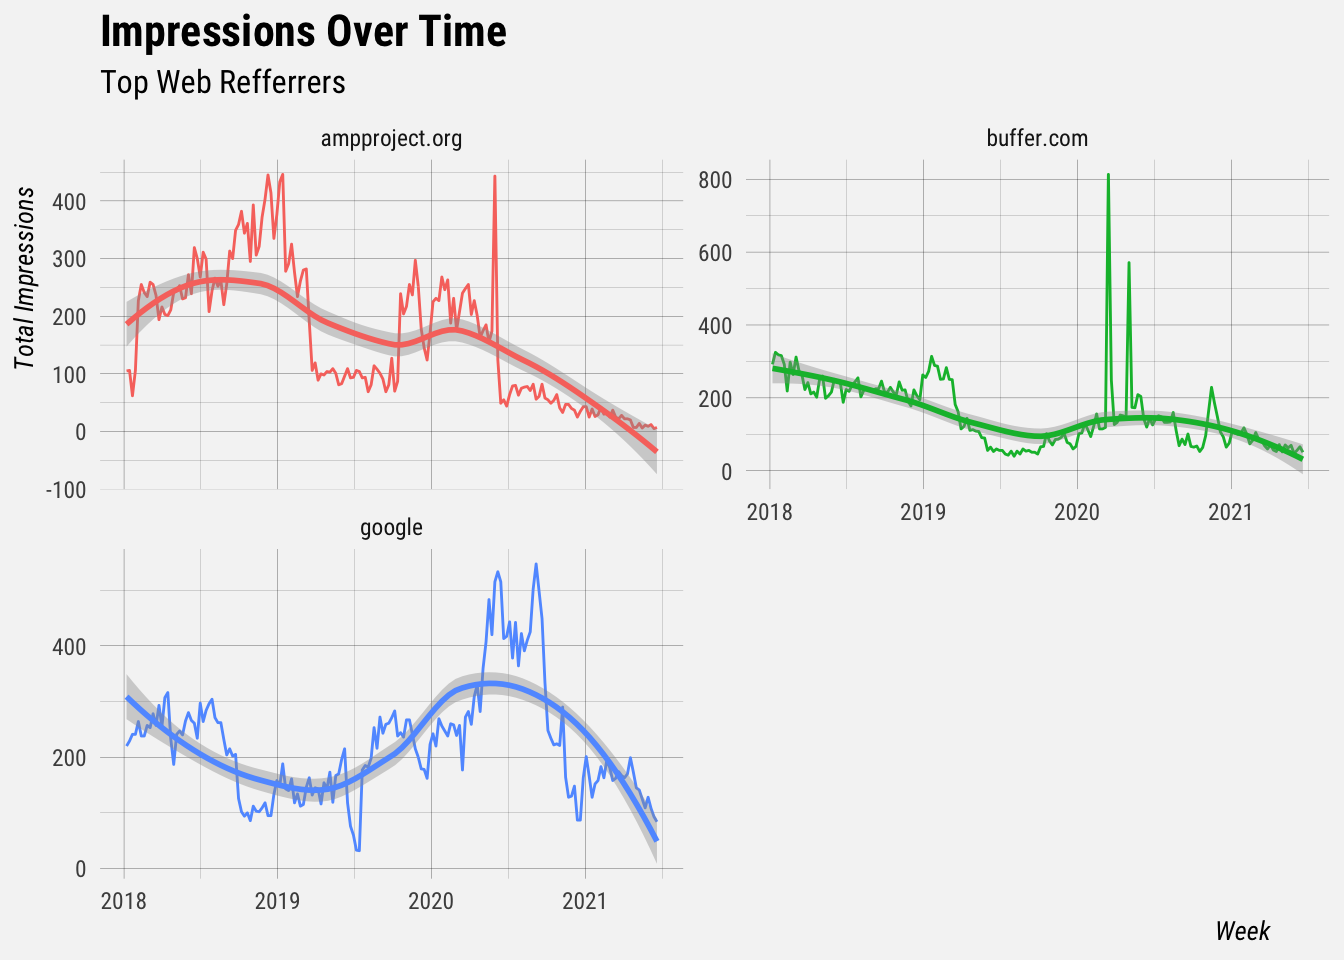
All three web referrers seem to be driving less impressions in recent months.