The purpose of this analysis is to, at a high level, estimate the proportion of revenue growth that is driven by marketing and the proportion that is driven by product. On its face this is a tough question to answer, but we can simplify things greatly if we make a couple key assumptions:
- If a user becomes a paying customer within 2 weeks of signing up, it is considered “driven by marketing”.
- If a user becomes a paying customer after 2 weeks of signing up, it is considered “driven by product”.
Given these two assumptions, the data gathered from customers that first started paying for Buffer in 2018 suggests that around 55% of revenue growth in 2018 was driven by product, and the remaining 45% by marketing. The average MRR value of customers that upgraded within 14 days of signing up is $23.23, and the average MRR value of customers that took more than 14 days to upgrade is $22.59.
Around 44% of customers that first started paying for Buffer in 2018 upgraded within 14 days of signing up, which means that 56% of customers took 15 days or more to upgrade.
At the end of this analysis there is an interactive plot that allows you to see how these proportions change if we change the assumption of about the number of days to upgrade – I’d recommend experimenting with a few differnt thresholds.
Data Collection
We can collect the data we need from the users, stripe_trials, and user_upgrade_facts tables. We will only look at users that first started paying for Buffer in 2018. This gives the newest users almost one month to upgrade and the oldest users around one year and one month.
select
  u.id as user_id
  , u.billing_stripe_customer_id as customer_id
  , date(u.created_at) as signup_date
  , date(uf.first_charge_at) as upgrade_date
  , uf.number_of_days_to_upgrade
  , date(min(t.trial_start_at)) as trial_start_date
  , date(min(t.trial_end_at)) as trial_end_date
  , max(mrr.mrr_amount) as mrr_value
from dbt.user_upgrade_facts as uf
inner join dbt.users as u
  on u.id = uf.user_id
left join dbt.stripe_trials as t
  on u.id = t.user_id
left join dbt.subscription_mrr_values as mrr
  on mrr.customer_id = u.billing_stripe_customer_id
where uf.first_charge_at >= '2018-01-01'
  and uf.first_charge_at < '2019-01-01'
  and uf.number_of_successful_charges >= 1
  and uf.number_of_days_to_upgrade >= 0
group by 1,2,3,4,5
This query returns around 37 thousand customers that began paying for Buffer in 2018.
Time to upgrade
Let’s plot the distribution of the number of days it took for these users to upgrade. This metric is calculated by calculating the number of days that elapsed between the user’s signup date and the date of the first successful, non-zero and non-refunded charge.
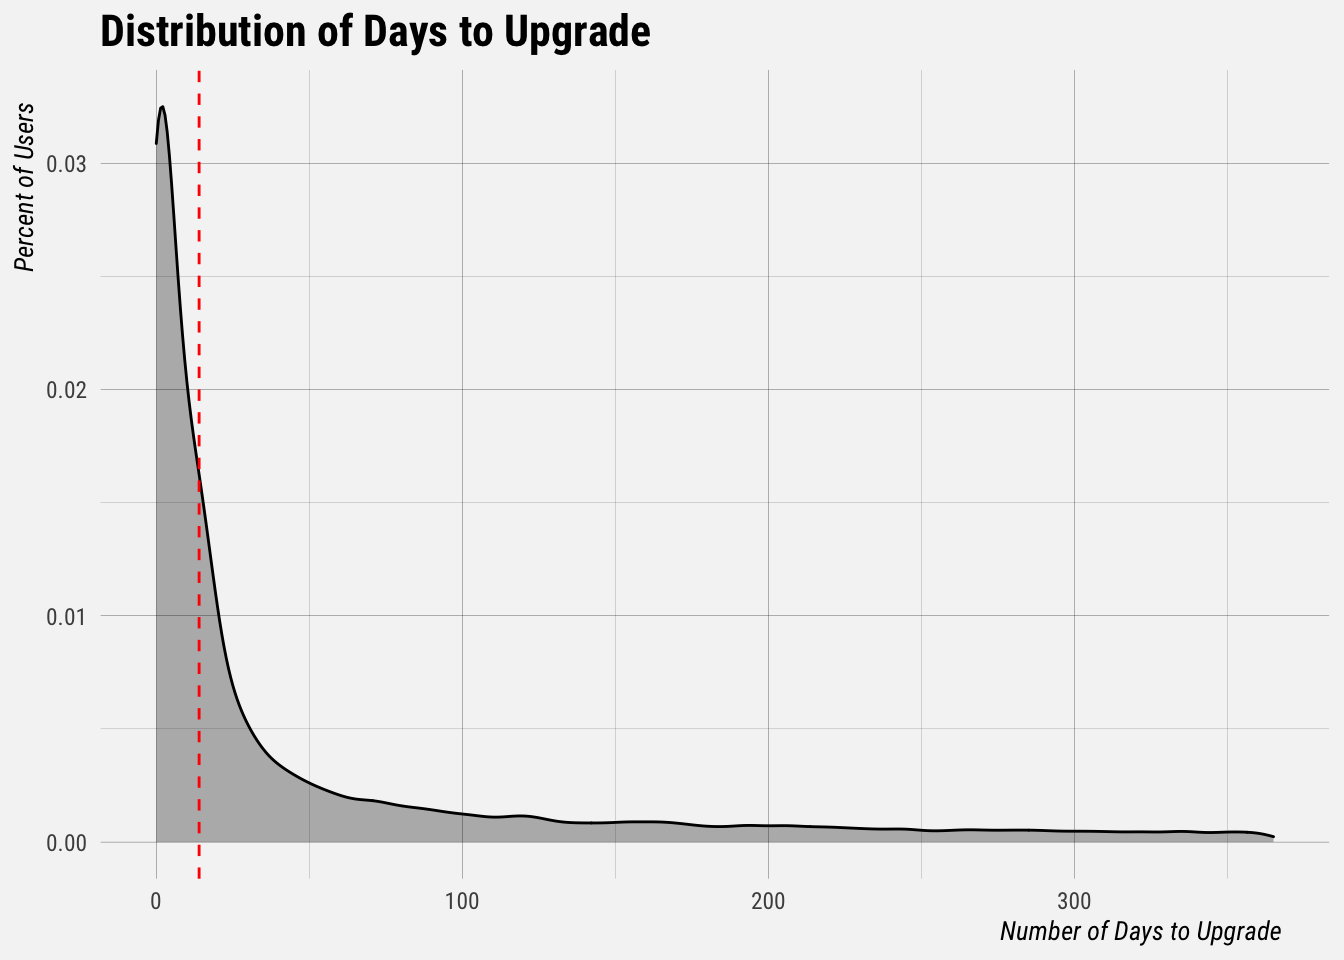
As we might have expected, there is a very long tail in this distribution, which indicates that a few users take a very long time to upgrade to a paid plan. The dotted red line represents day 14.
Driven by Product, or Marketing?
Let’s calculate the proportion of customers that were driven by Product and the proportion driven by Marketing given the assumptions made at the beginning of this post.
## `summarise()` ungrouping output (override with `.groups` argument)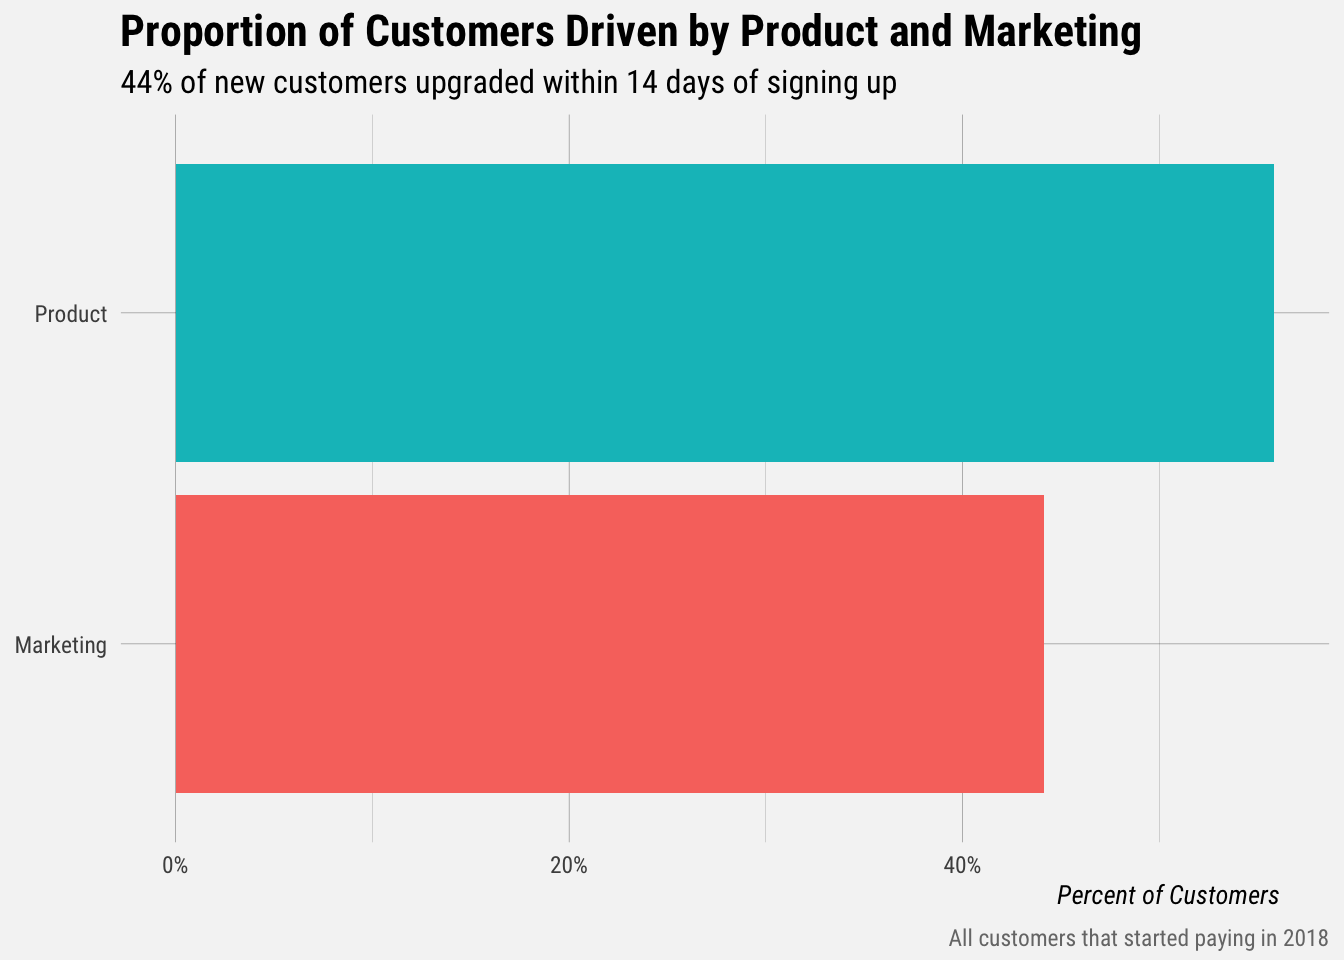
Around 44% of customers that first started paying for Buffer in 2018 upgraded within 14 days of signing up, which means that 56% of customers took 15 days or more to upgrade. Now let’s plot the proportion or MRR that came from users that upgraded within 14 days of signing up.
## `summarise()` ungrouping output (override with `.groups` argument)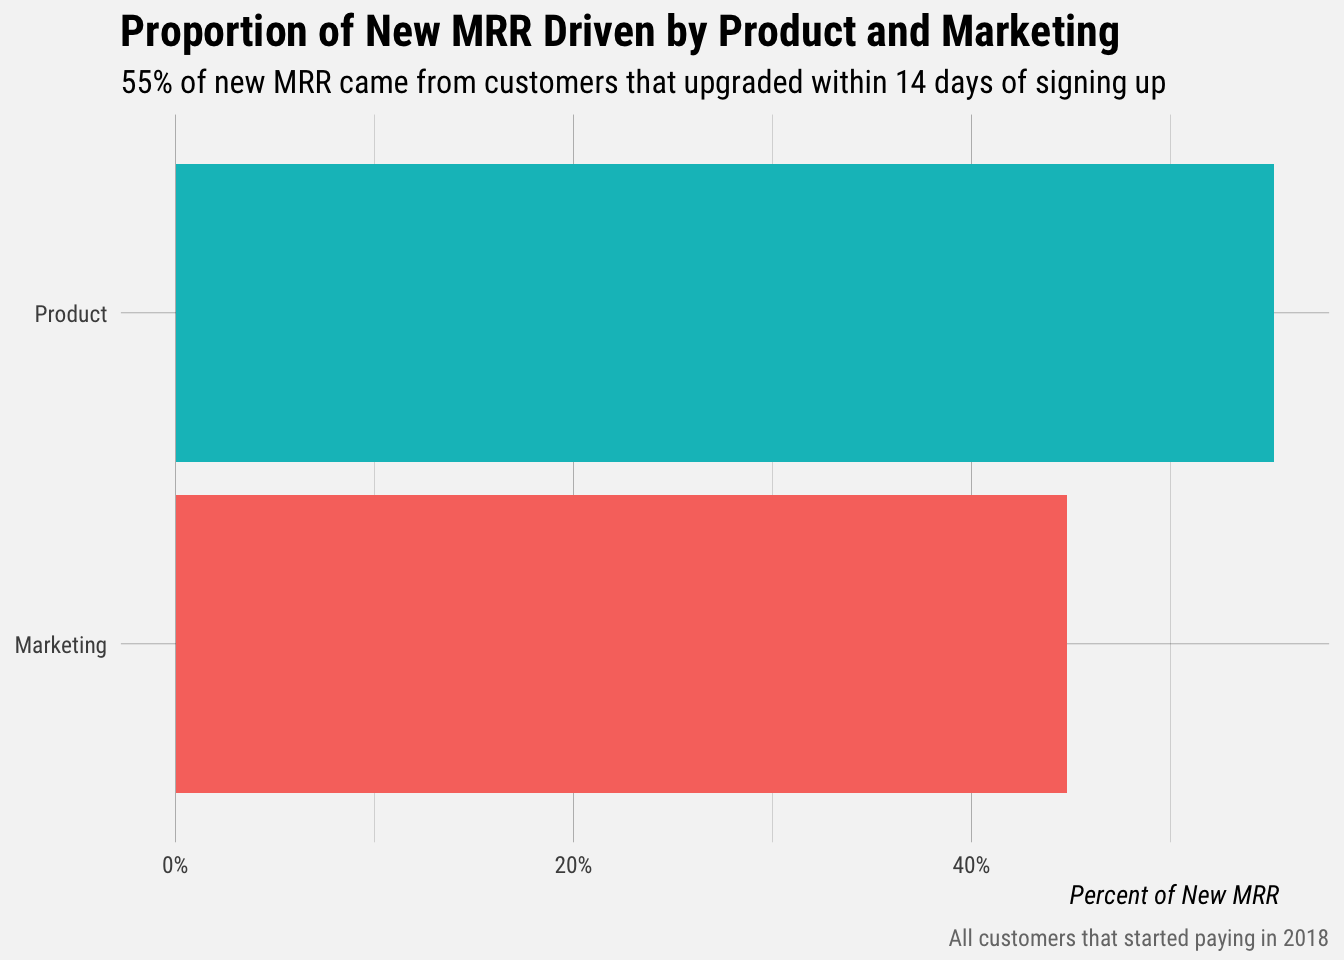
Around 45% of new MRR gained from customers that first started paying in 2018 came from users that upgraded within 14 days of signing up. We can calculate the average MRR amount of customers in each group.
## `summarise()` ungrouping output (override with `.groups` argument)## # A tibble: 2 x 2
## driver avg_mrr
## <chr> <dbl>
## 1 Marketing 23.2
## 2 Product 22.6The average MRR value of customers that upgraded within 14 days of signing up is $23.23, and the average MRR value of customers that took more than 14 days to upgrade is $22.59. These are roughly equal.
The 14-day threshold we’ve used so far makes intuitive sense, but it might also be worth exploring how these proportions change if we use 7 days, 3 days, and 1 day as alternative thresholds.
## `summarise()` ungrouping output (override with `.groups` argument)
## `summarise()` ungrouping output (override with `.groups` argument)
## `summarise()` ungrouping output (override with `.groups` argument)
## `summarise()` ungrouping output (override with `.groups` argument)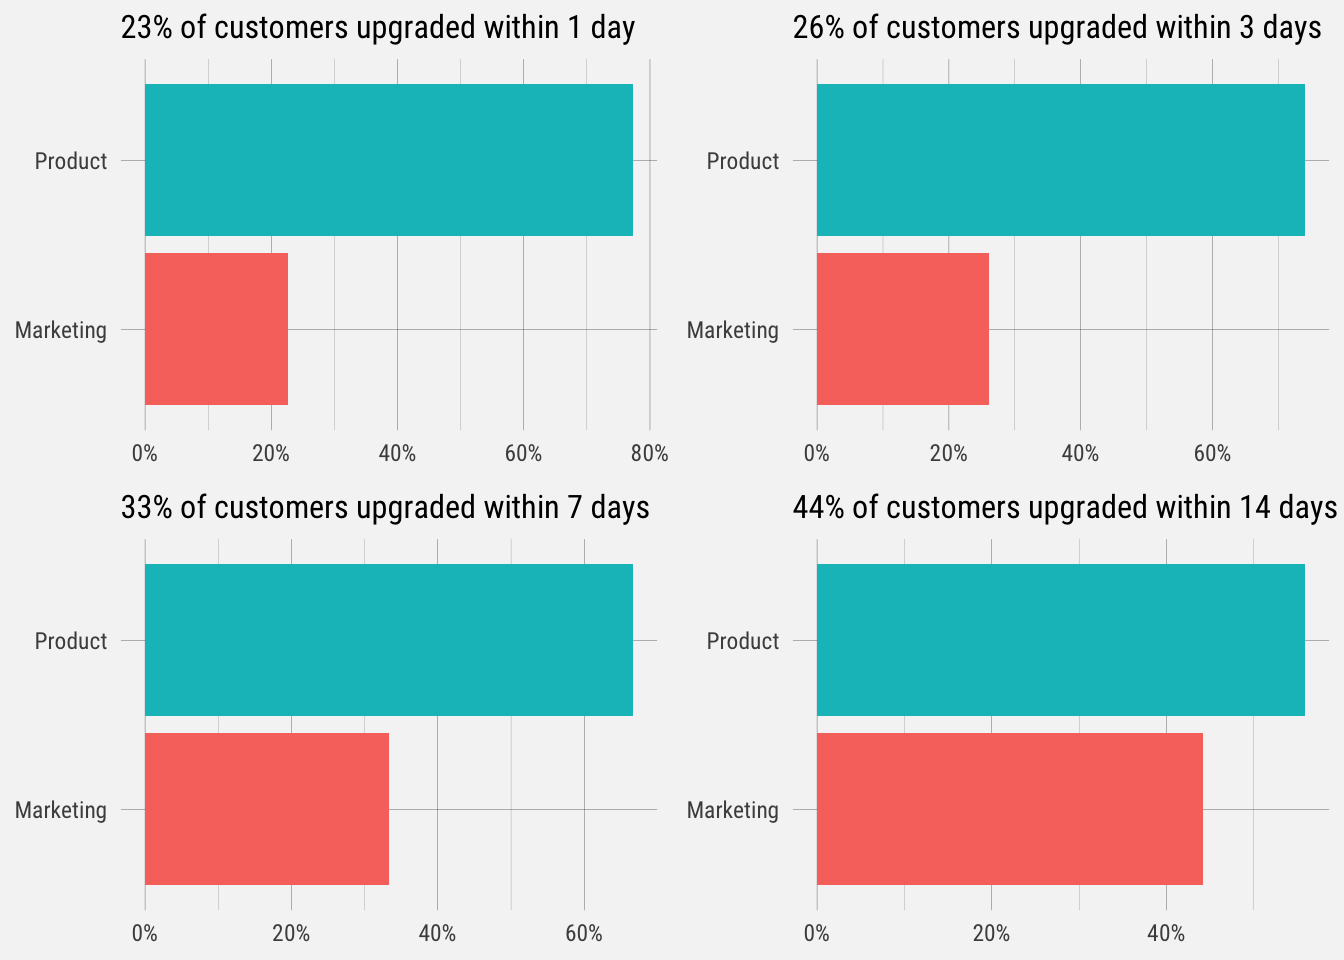
A cumulating distribution function tells us this proportion for every day we could use as a threshold. If you hover over any point on the curve, you will see a y value that represents the proportion of users that took X days or less to upgrade.
For example, if you find the point on the curve where number of days to upgrade = 7, you will see that y = 0.457. This can be interpreted as 33.3% of all users took 7 days or less to upgrade. From this, we can infer that 66.7% of users took more than 7 days to upgrade. This process can be followed for any point on the curve.
We can replicate this CDF for the proportion of new MRR gained in 2018 as well.