In this analysis we will explore the progress tracker that appears when users start Business trials. We will try to determine the proportion of trialists that complete the tasks listed in the tracker and measure the effect that this has on trial conversion rates.
In the analysis we find that around 38 thousand Business trialists have seen the progress tracker since January 2018. Of those, around 45% completed the steps outlined in the tracker. We also see a clear and significant correlation between actions taken to complete the progress tracker and the Business trial conversion rate.
select
  a.id
  , a.user_id
  , a.created_at
  , a.full_scope
  , a.scope3 as action
  , case when a.full_scope = 'dashboard progress_tracker shown' then 'task0_tracker_shown'
         when a.full_scope = 'dashboard progress_tracker opened' then 'task0_tracker_shown'
         when a.full_scope = 'dashboard progress_tracker completed' then 'completed'
          else a.scope4 end as task
from actions_taken as a
where a.full_scope like 'dashboard progress_tracker%'
and a.created_at >= '2018-01-01'
We have 416k actions from January 2018 on to work with.
Building a Funnel
Let’s count the number of users that made it through each step of the tracker.
## `summarise()` ungrouping output (override with `.groups` argument)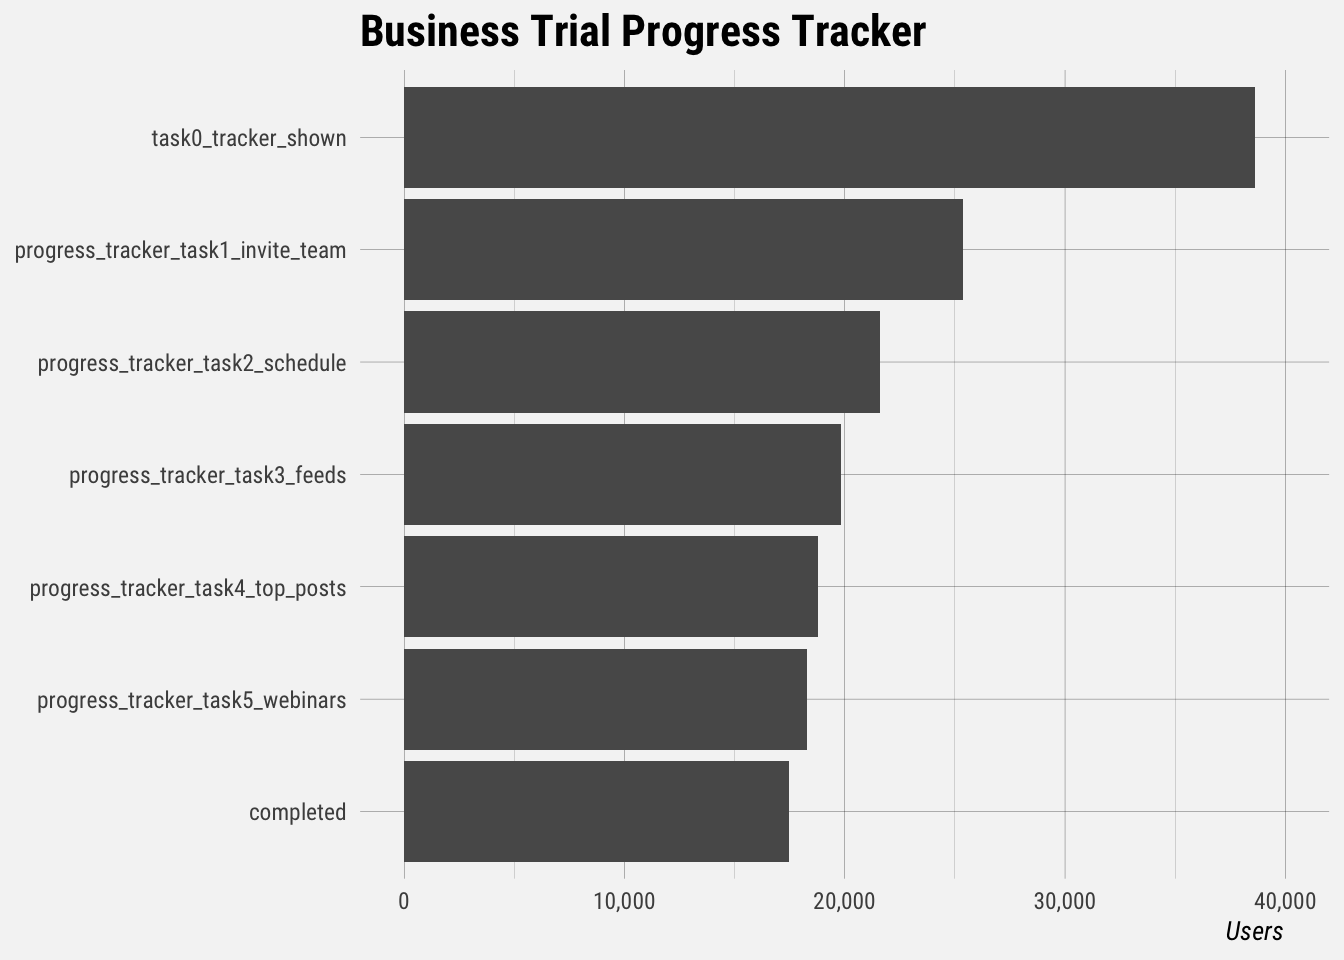
We can see that around 38 thousand Business trialists have seen the progress tracker since January 2018. Of those, around 45% have completed the steps outlined!
Effect on Trial Conversions
Let’s gather all the Business trials that started since January 1, 2018.
select
  t.*
from dbt.stripe_trials as t
where t.simplified_plan_id = 'business'
and t.stripe_event_created_at >= '2018-01-01'
There are 58k Business trials that started since January 2018. Now let’s get the last progress tracker action for each user.
# get most recent action for each user
last_action <- actions %>%
  filter(!(task %in% tasks_to_exclude) & !is.na(task)) %>%
  group_by(user_id) %>%
  summarise(last_action_date = max(created_at)) %>%
  inner_join(actions, by = c("user_id" = "user_id", "last_action_date" = "created_at"))
## `summarise()` ungrouping output (override with `.groups` argument)Now we can compare the trial conversion rates for each of these users.
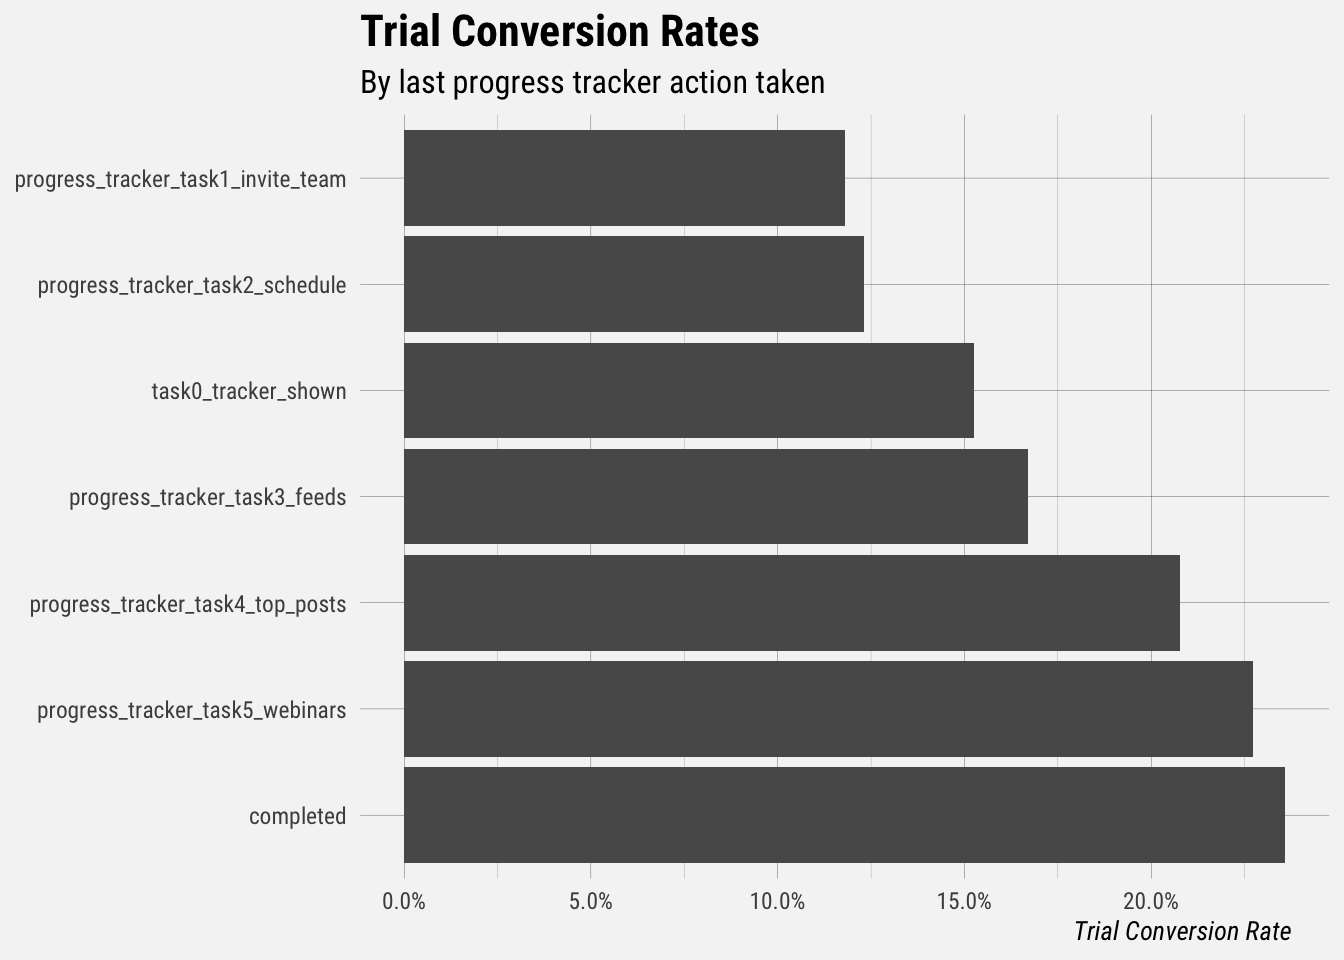
We can see clearly that users that progress further along the progress tracker have a higher probability of converting their trial.