In this analysis we will explore the rates at which existing users upgrade to paid plans in New Publish and Buffer Classic, and how long they take to do it.
Summary
The rate at which new users upgrade to Pro plans is higher for users of Buffer Classic, and this difference grows as the number of days since being put on the experiment increases, i.e. the gap between the upgrade rates is wider at day 7 than it is at day 1.
Data Collection
We’ll collect the data from Redshift with the query below. We’ll only look at existing users that were put on New Publish on or after February 6, the date we increased the rollout percentage to New Publish.
with first_charge as (

  select
    u.id as user_id
    , c.customer as customer_id
    , date(u.created_at) as signup_date
    , date(ue.created_at) as date_added_to_experiment
    , ue.name as experiment
    , ue."group" as ex_group
    , min(c.created) as first_charge_date
  from dbt.users as u
  inner join dbt.user_experiments as ue
    on u.id = ue.user_id
    and ue.name like 'new_publish_existing_buffer_free_users_phase%'
    and ue.created_at >= '2019-02-06'
  left join dbt.stripe_charges as c
    on c.customer = u.billing_stripe_customer_id
    and c.created >= ue.created_at
    and c.amount > 0
    and c.captured
    and not c.refunded
  group by 1,2,3,4,5,6

)


select
  fc.*
  , c.simplified_plan_id as first_charge_plan
  , datediff(day, fc.date_added_to_experiment, fc.first_charge_date) as days_to_upgrade
from first_charge as fc
left join dbt.stripe_charges as c
  on c.customer = fc.customer_id
  and c.created = fc.first_charge_date
  and c.amount > 0
  and c.captured
  and not c.refunded
group by 1,2,3,4,5,6,7,8
There are around 131 thousand users in this dataset. Now we’re ready to do some exploratory analysis.
Upgrade Rates
Let’s calculate the proportion of users that upgraded to a paid plan at some point.
## `summarise()` regrouping output by 'ex_group' (override with `.groups` argument)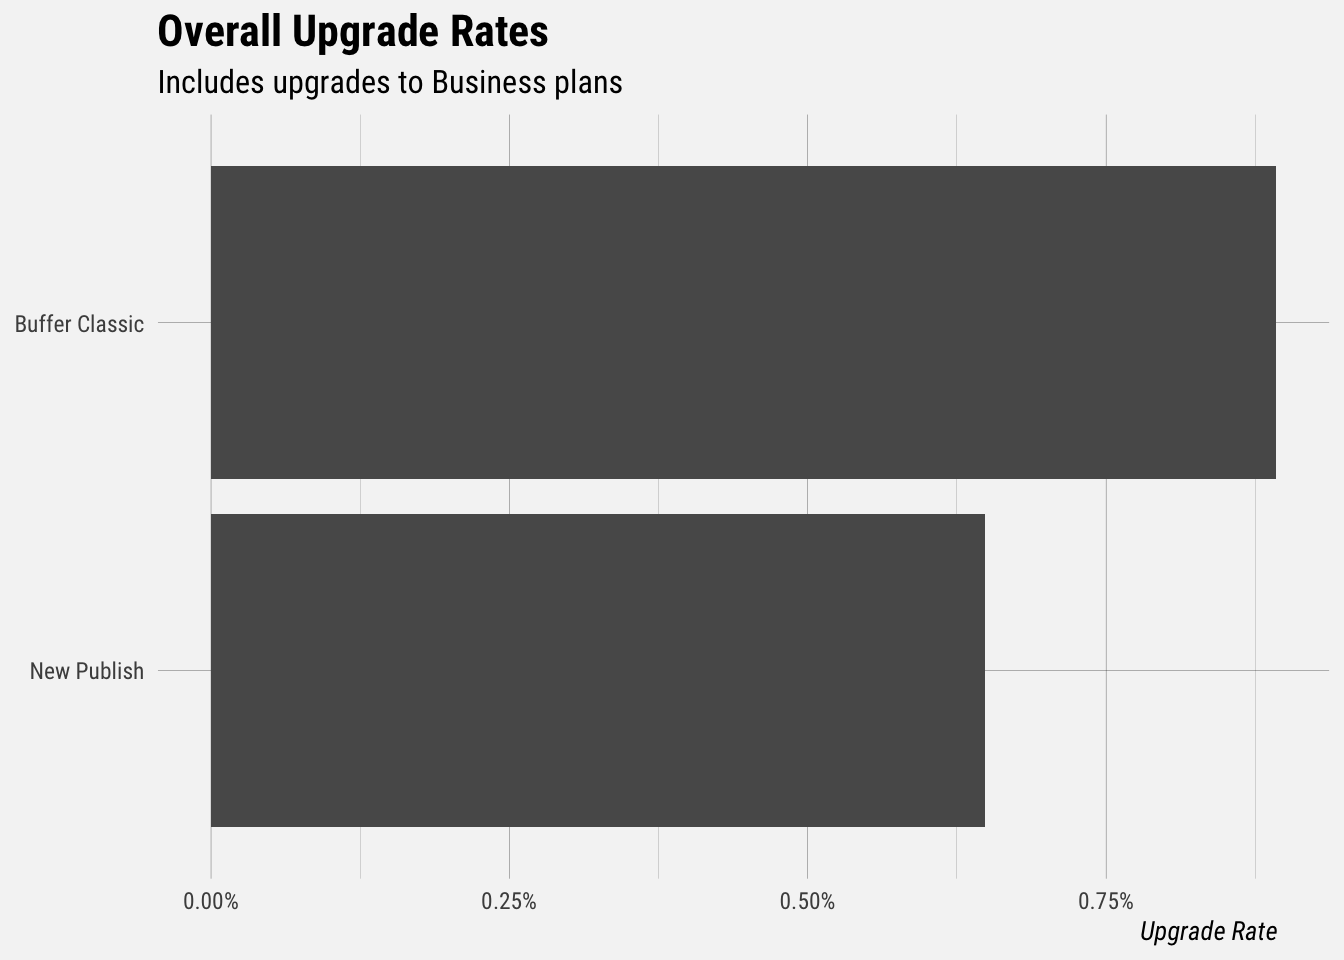
Around 0.89% of users in Buffer Classic have upgraded to a paid plan since being put on the experiment, and around 0.65% of users in New Publish have upgraded since being put on the experiment. New Publish users don’t have the Business upgrade paths, so let’s only look at Pro upgrades.
## `summarise()` regrouping output by 'ex_group' (override with `.groups` argument)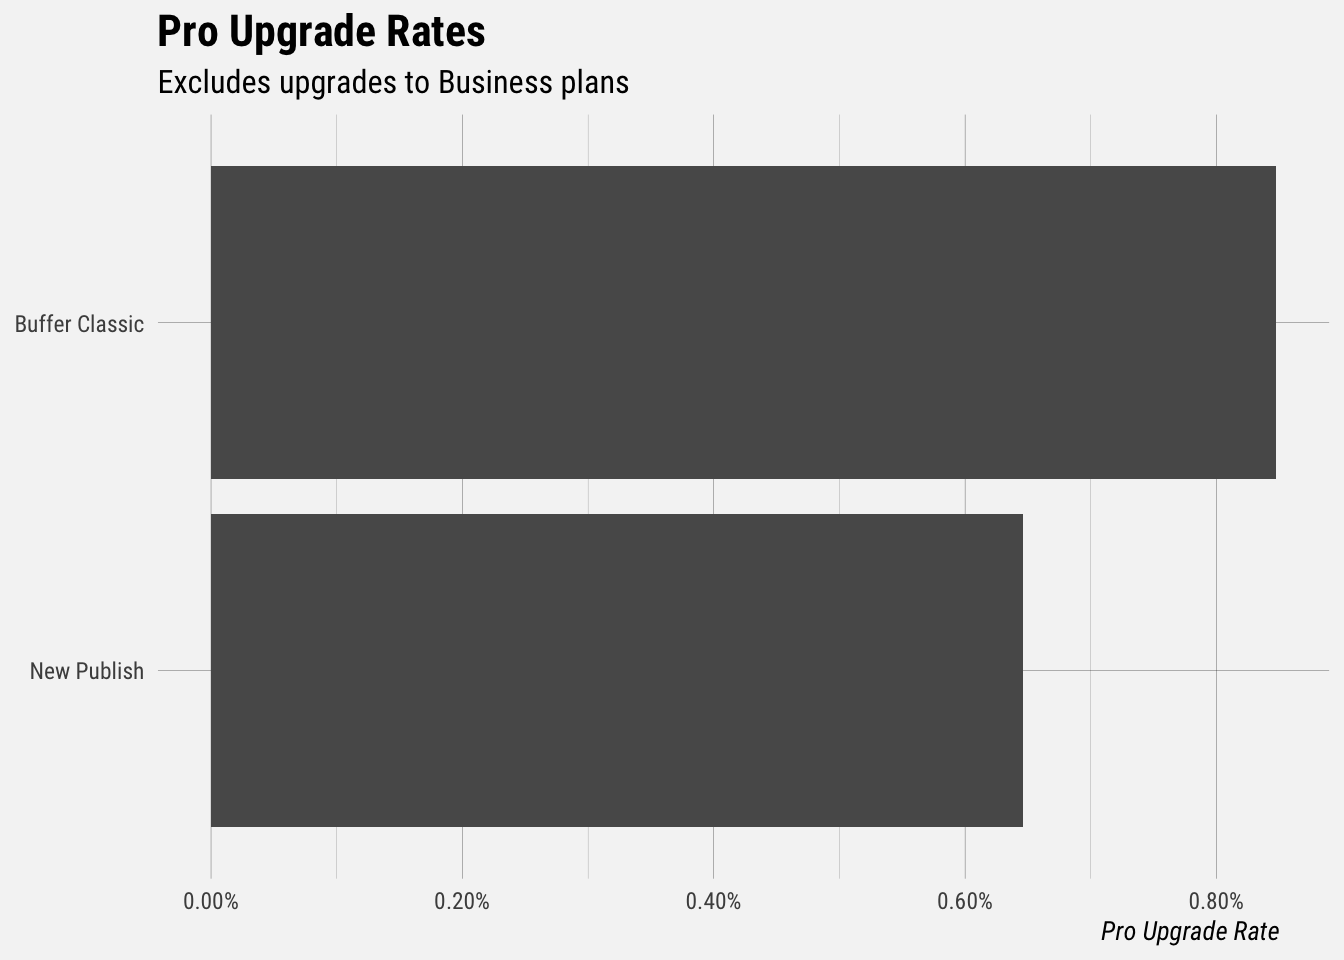
Around 0.85% of Classic users upgraded to Pro after being put on the experiment, compared to around 0.65% of users put on New Publish.
Upgrade Rates Over Time
Let’s see how the upgrade rates compare for users after 1 day in the experiment, 2 days, etc.
This graph shows us a few things:
- The Pro upgrade rate starts out higher for Buffer Classic users (i.e. more people upgrade on the first day)
- The Pro upgrade rate grows more quickly over time for Buffer Classic users
- There is a point at which upgrades in New Publish become quite rare (around 10 days after being put in experiment)
We can also plot the differences in the upgrade rates for each day after being put in the experiment group
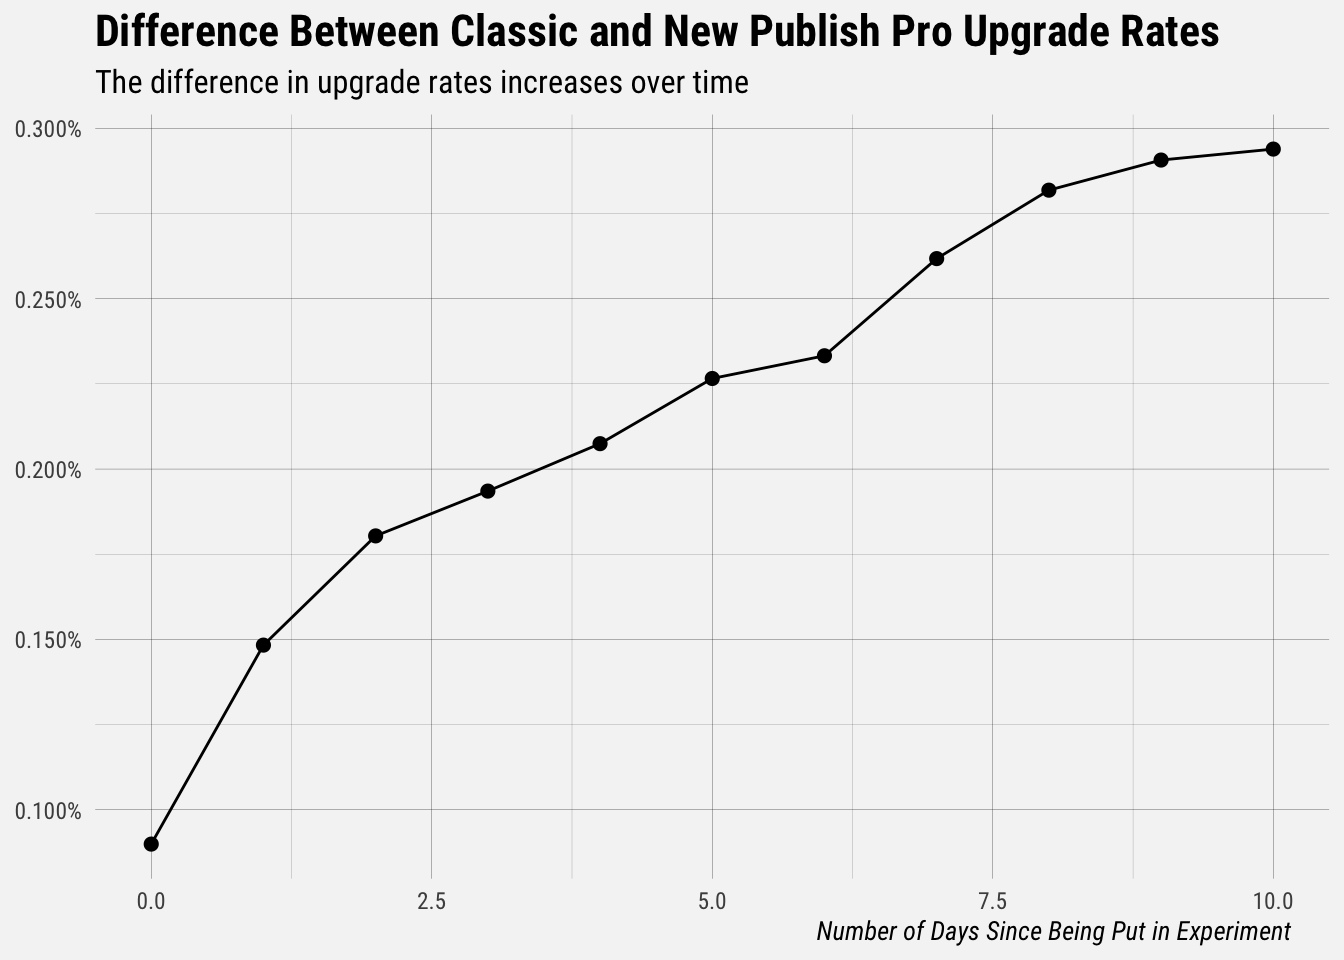
This graph shows us the difference in the New Publish and Classic upgrade rates for the first day on the experiment through the 8th day on the experiment. We can see that the difference in the upgrade rates is quite small in the first day, however it grows as time goes on.