On February 21 we launched the target customer survey to all new Reply users. In this analysis we will try to determine if the introduction of the survey had any effect on onboarding completions and trials started. The survey is shown to people that have already signed up for Reply, so we will not measure the effect on signups.
The results of this experiment suggest that the target customer survey has had no negative effect on onboarding completion or trial starts.
Impact on Onboarding Completion
We’ll gather the raw events from Redshift and use the same methods to measure the experiment’s effect over time.
select
  date(a.created_at) as date
  , a.user_id
  , a.id as event_id
from buda.actions_taken a
where a.action = 'complete_onboarding_success'
and a.created_at >= current_date - 60
Now let’s plot the number of events that occurred each day.
## `summarise()` ungrouping output (override with `.groups` argument)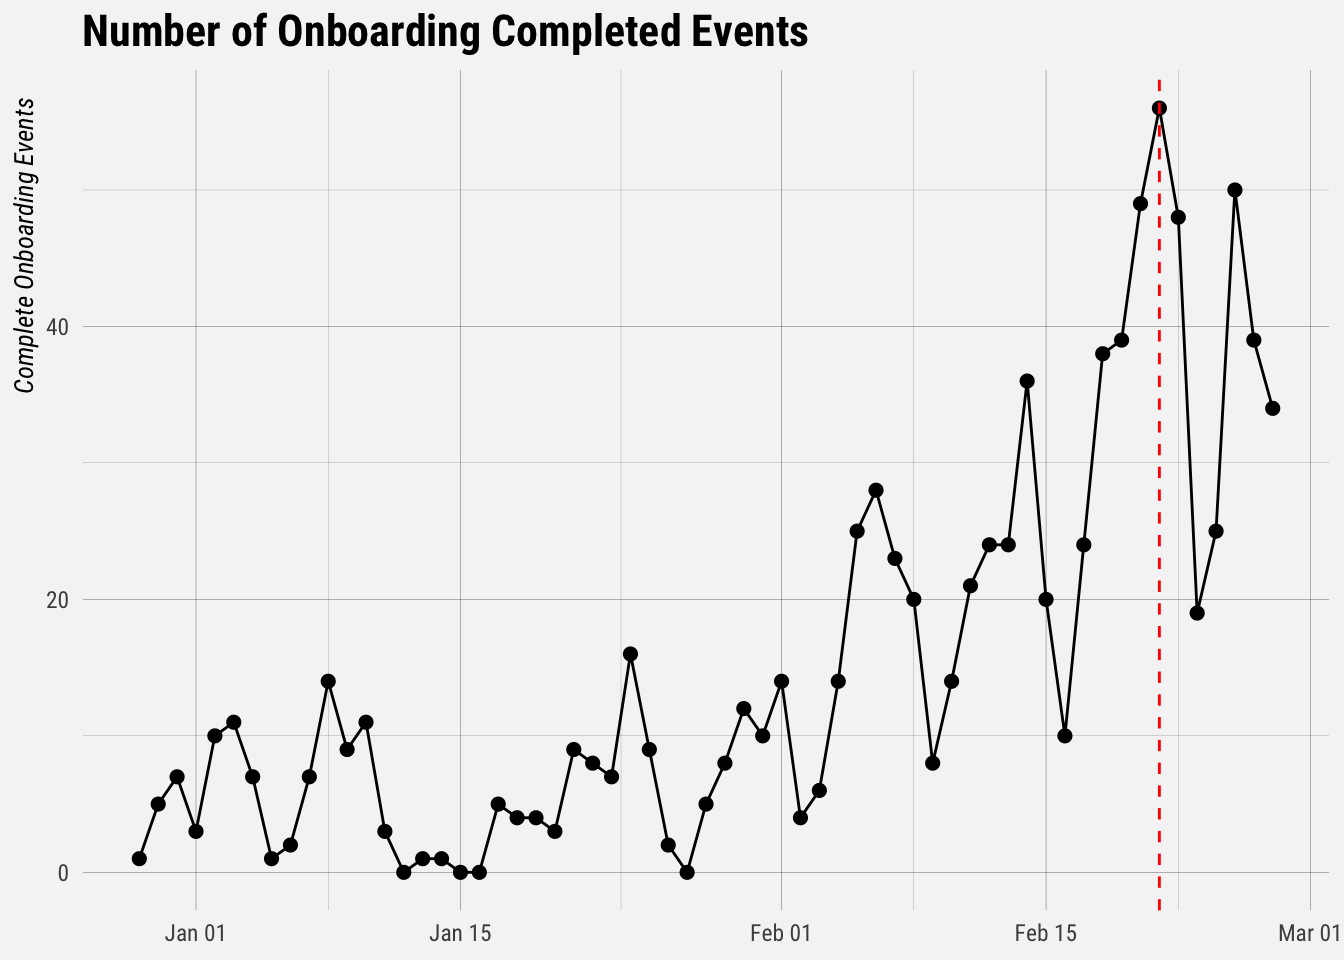
We can see that the number of events has increased quite a bit since the beginning of February. We can also see that there is clearly some seasonality, i.e. the number of events is dependent on the day of the week. Because we don’t have experiment groups, we can run a causal impact analysis to estimate the effect that the target customer survey had.
Essentially, we take the number of onboarding completion events before we introduced the survey and forecast it into the future. Then we compare the forecast with the actual observed values. The difference between the counterfactual (what onboarding completions would have been without the survey) and the observed number of completions is our estimated effect size.
The “pre-intervention period”" includes dates from December 28, 2019 (which is 60 days ago) to February 26.
To perform inference, we run the analysis using the CausalImpact command.
# run analysis
impact <- CausalImpact(reply_ts, pre.period, post.period, model.args = list(niter = 5000, nseasons = 7))

# plot impact
plot(impact) +
  labs(title = "Impact on Reply Onboarding", subtitle = "There is no evidence of a negative impact on onboarding") +
  buffer_theme()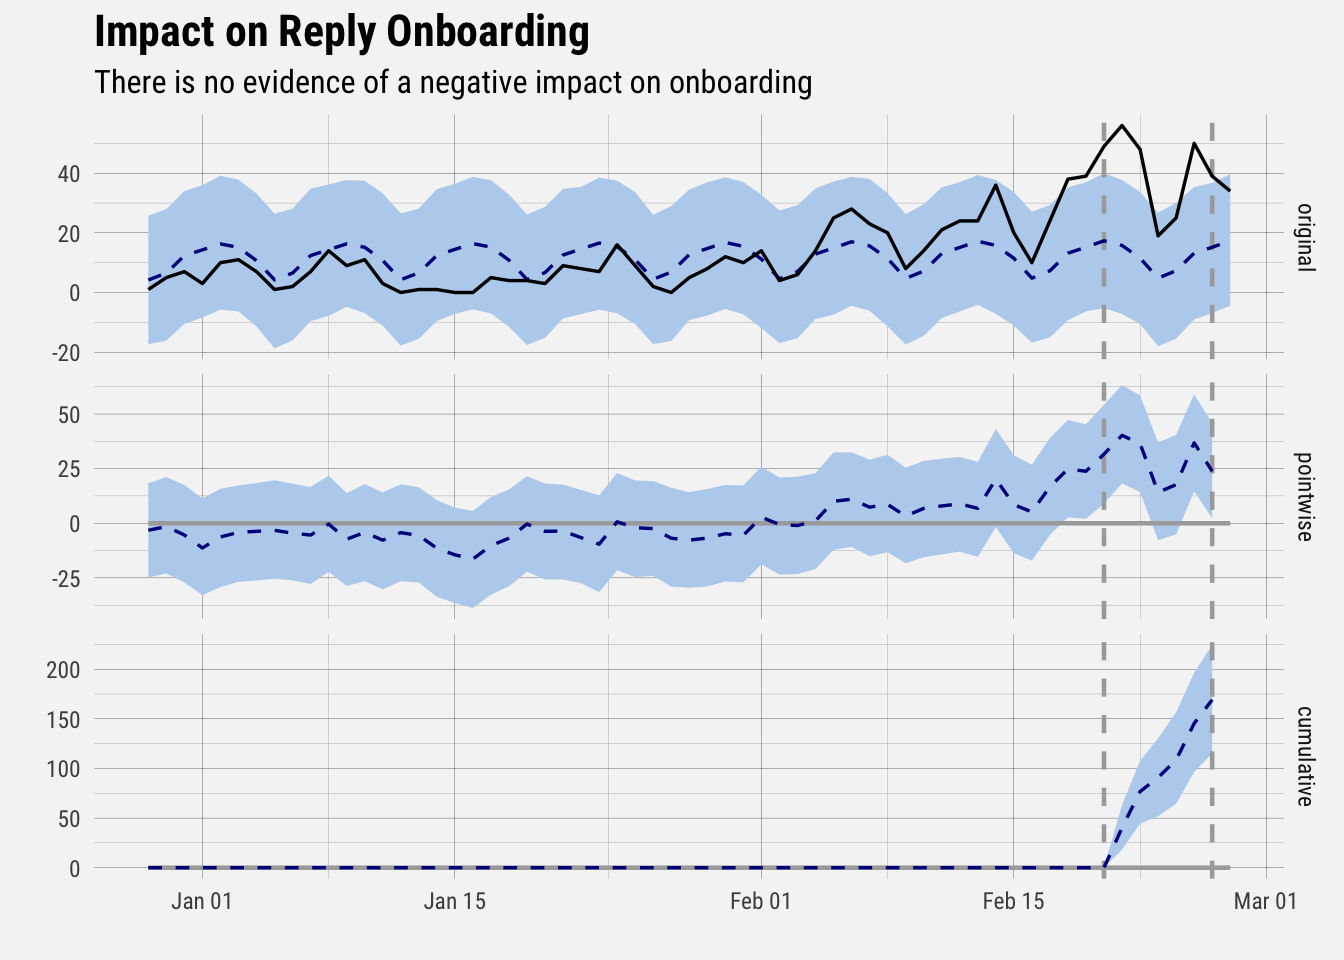
The pre-intervention period includes all data to the left of the first vertical dotted line, and the post-intervention period includes all data to the right of the second vertical dotted line.
The top panel in the graph shows the actual observed data (the black line) as well as the counterfactual (the dotted line), which is our best guess at what the number of onboarding completion events would have been had we not introduced the survey.
The second panel displays the estimated effect that the survey had on onboarding each day, and the bottom panel shows the cumulative effect over time on onbording completion events.
We can see that there does not appear to be evidence of a negative effect on onboarding completion. Now, let’s take the same approach but look at the number of trials started.
Effect on Trials
Let’s use the same technique to measure the impact on Stripe trials.
select
  date(t.trial_start_at) as date
  , t.customer_id
  , t.stripe_event_id as event_id
from dbt.stripe_trials t
where t.simplified_plan_id = 'reply'
and t.trial_start_at >= current_date - 60
Now let’s plot the number of trials started each day.
## `summarise()` ungrouping output (override with `.groups` argument)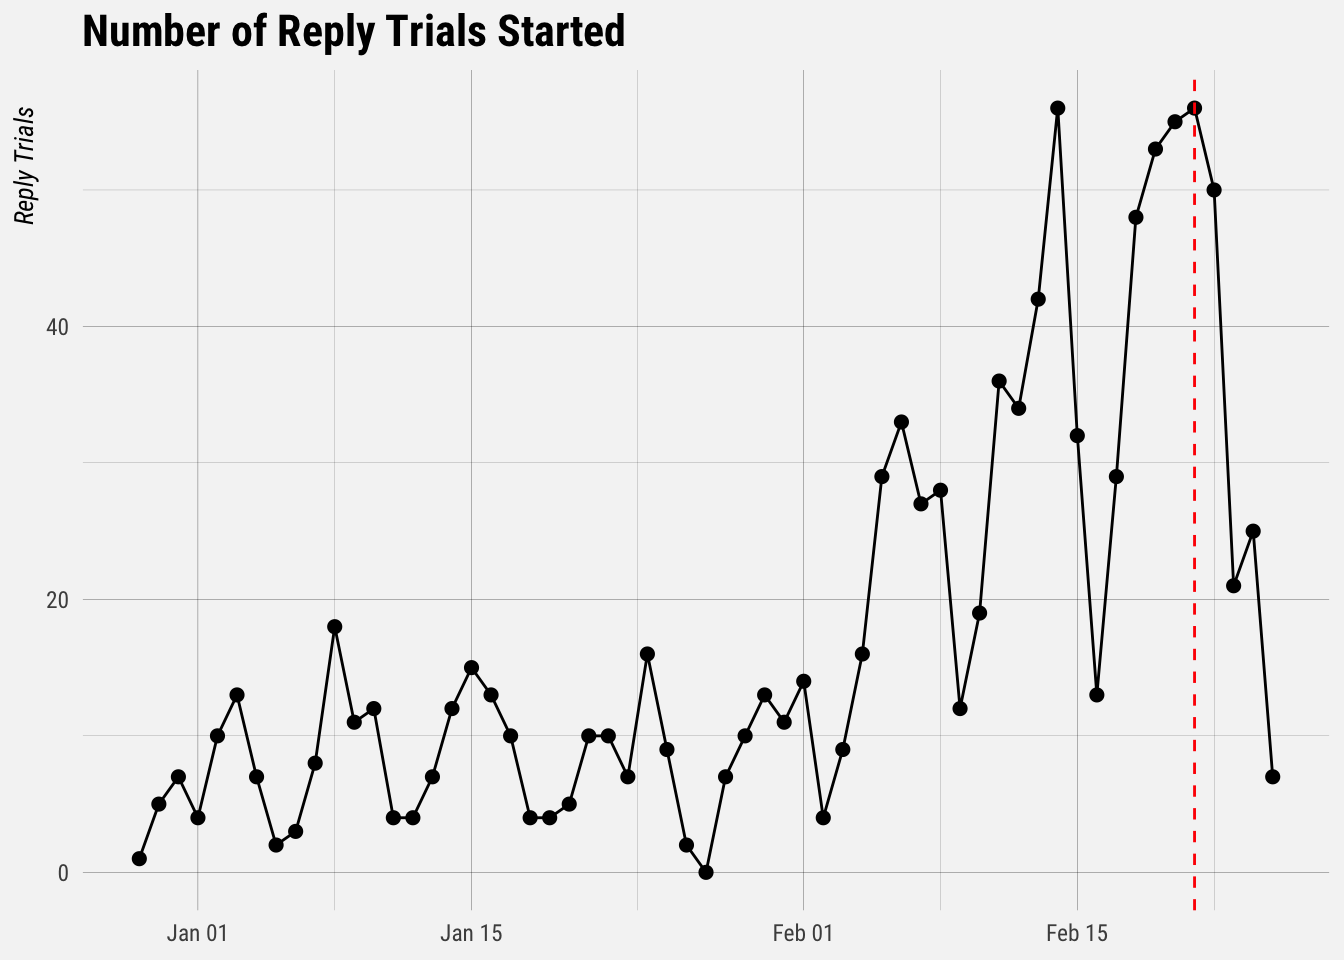
There doesn’t appear to be a huge negative effect on Stripe trials.
# run analysis
impact <- CausalImpact(trials_ts, pre.period, post.period, model.args = list(niter = 5000, nseasons = 7))
# plot impact
plot(impact) +
labs(title = "Impact on Reply Trials", subtitle = "There is no evidence of a negative impact on Reply trials.") +
buffer_theme()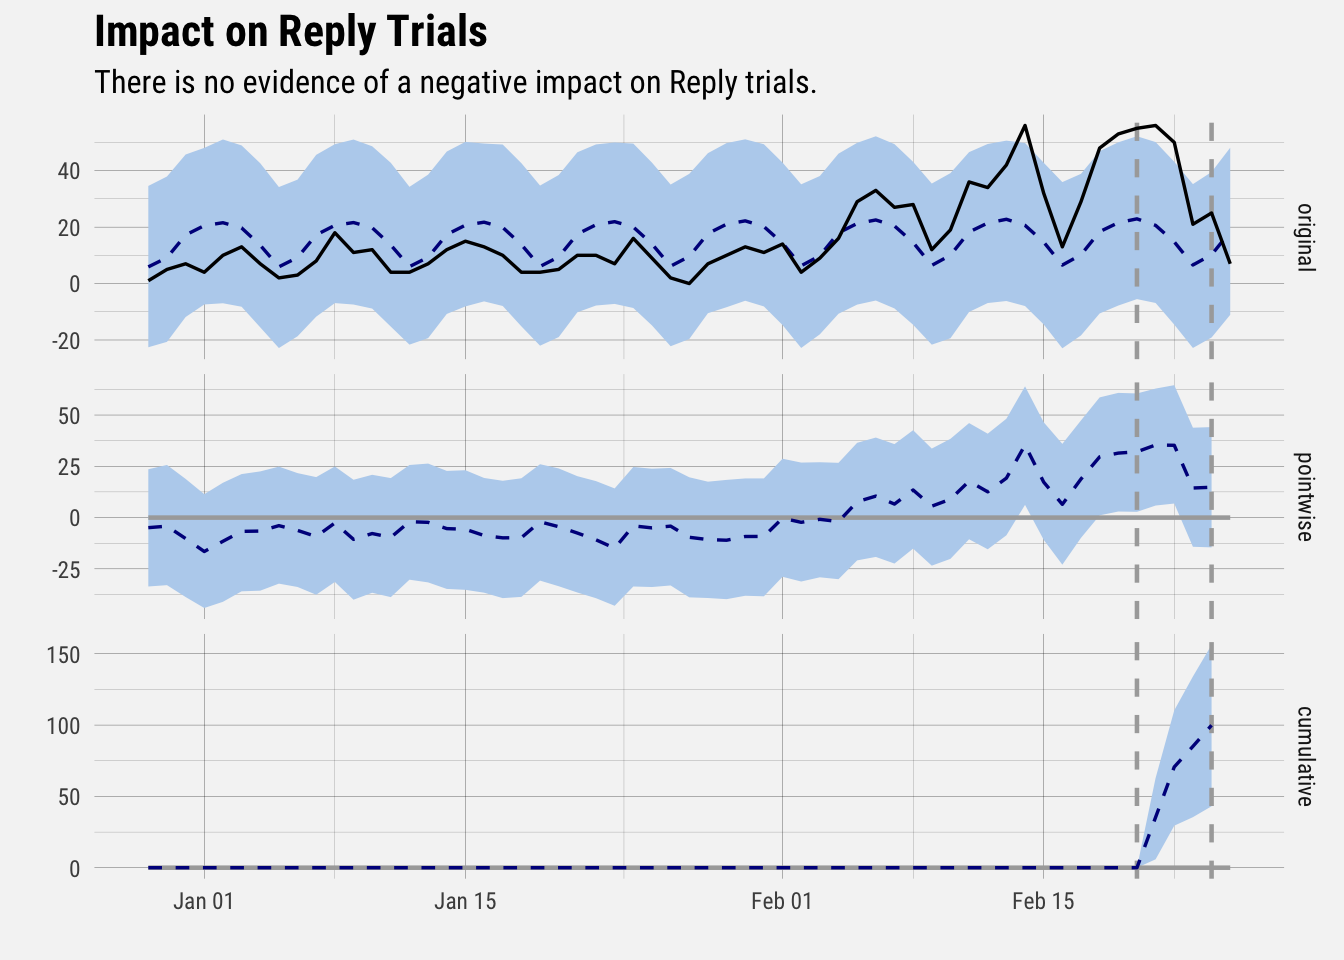 Similar to what we saw with onboarding, there does not appear to be evidence suggesting that the experiment negatively impacted the number of people that started Reply trials.