In this post we’ll visualize the distribution of daily MRR growth. We want to know how much MRR grows in a typical day. We’ll use the characteristics of the distribution to create an alert that will notify us if MRR grows more or less than a certain amount in a single day.
Data Collection
We’ll only look at MRR growth number from the past six months. The data includes MRR from the Stripe, Apple, Android, and Manual gateways.
select
  date
  , sum(total_mrr) as mrr
from dbt.daily_mrr_values
where date <= '2019-03-20' and date >= '2018-09-21'
group by date
order by date desc
This is what the resulting dataframe looks like.
head(mrr)## date mrr
## 1 2019-03-20 1623493
## 2 2019-03-19 1623313
## 3 2019-03-18 1620966
## 4 2019-03-17 1621821
## 5 2019-03-16 1622528
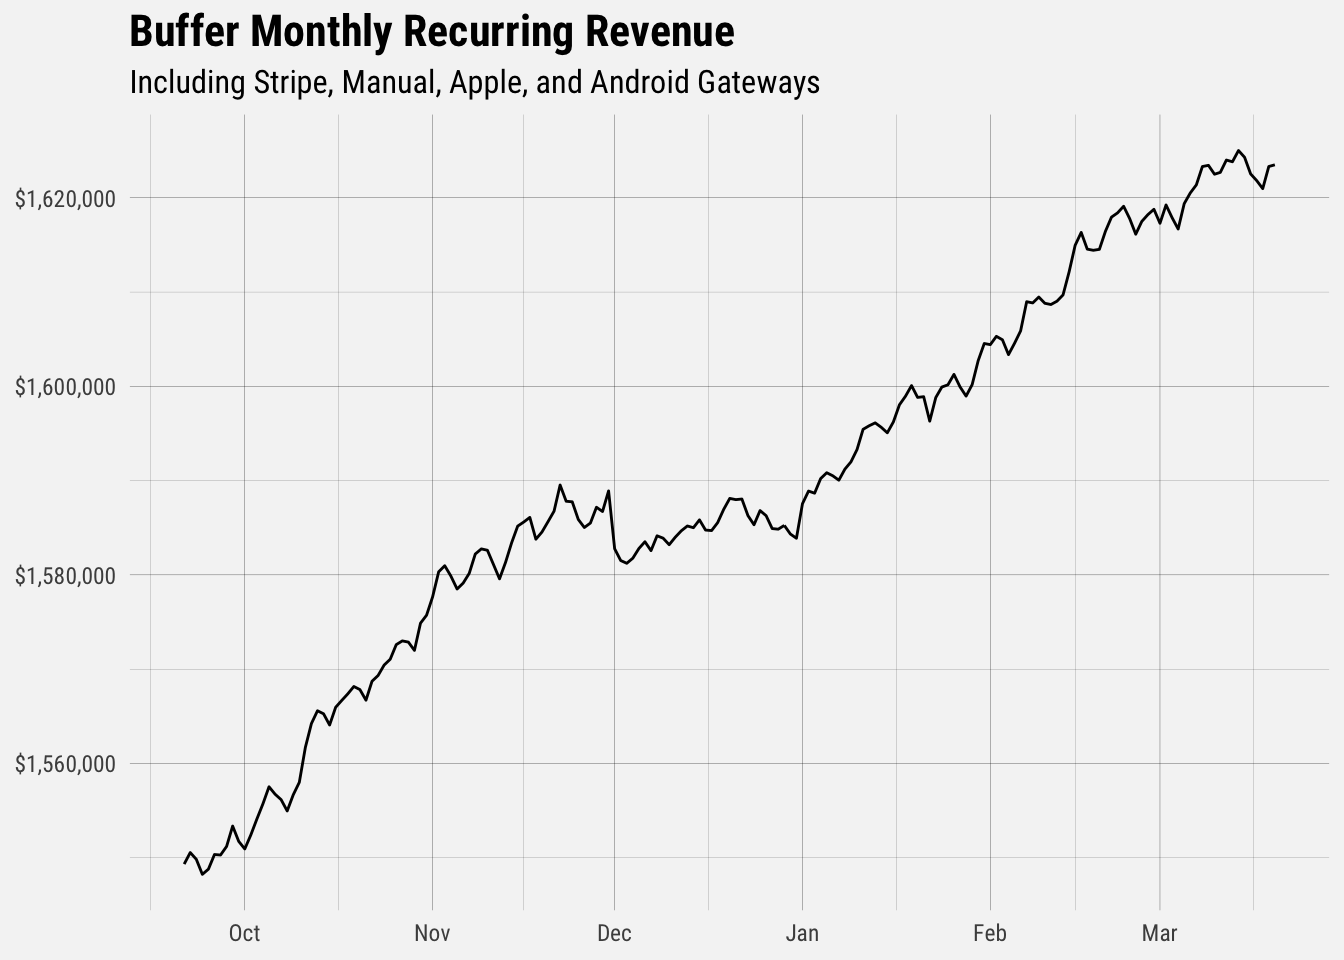
## 6 2019-03-15 1624293Visualizing MRR Growth
Now we can visualize total MRR over time.
We can also visualize total MRR growth over time.
# add column for growth
mrr <- mrr %>%
  mutate(growth = mrr - lead(mrr, 1))
## `geom_smooth()` using formula 'y ~ x'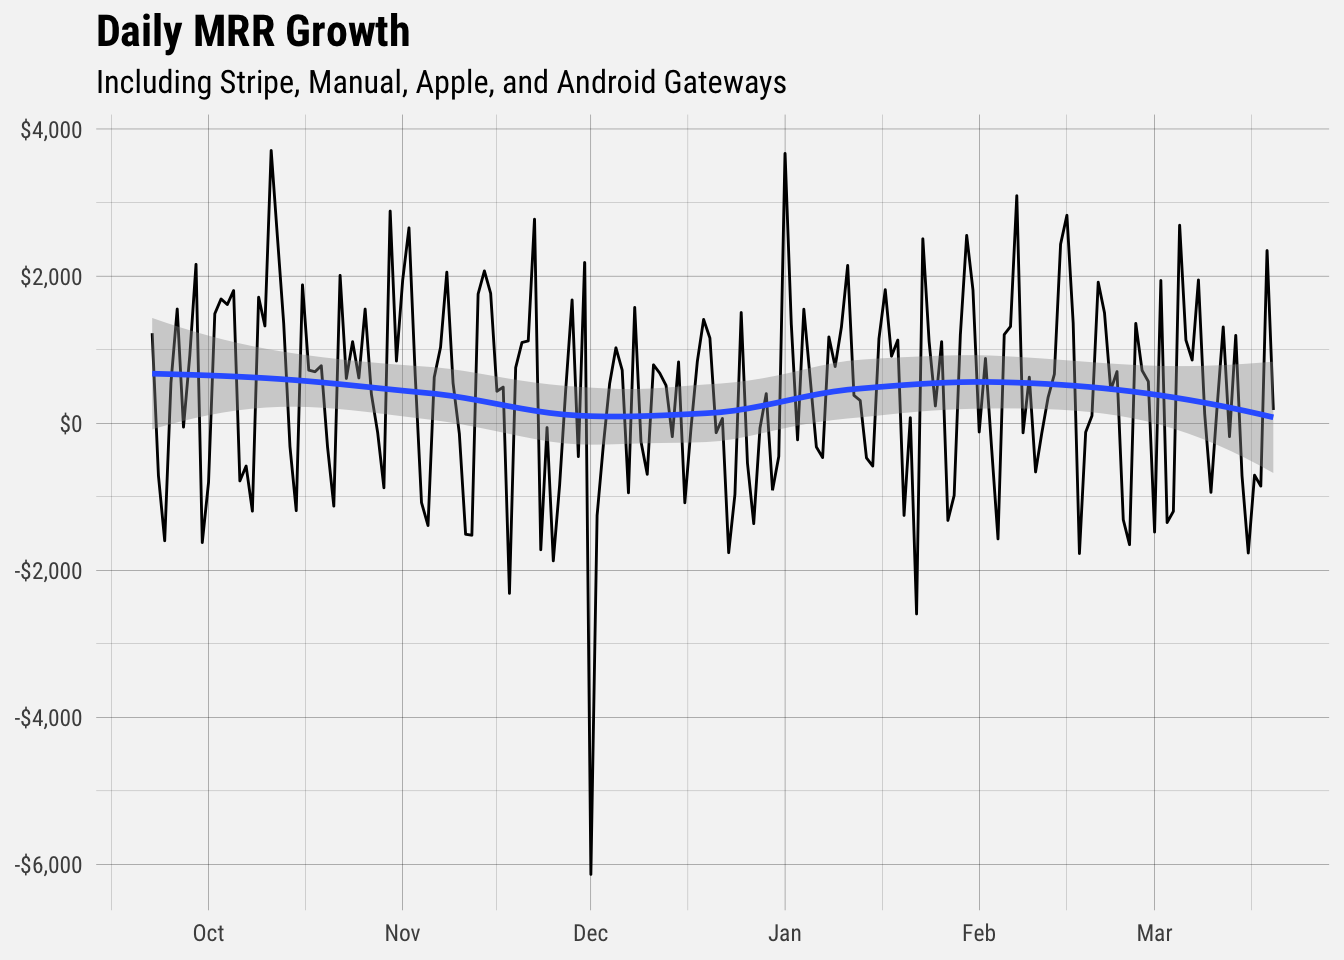
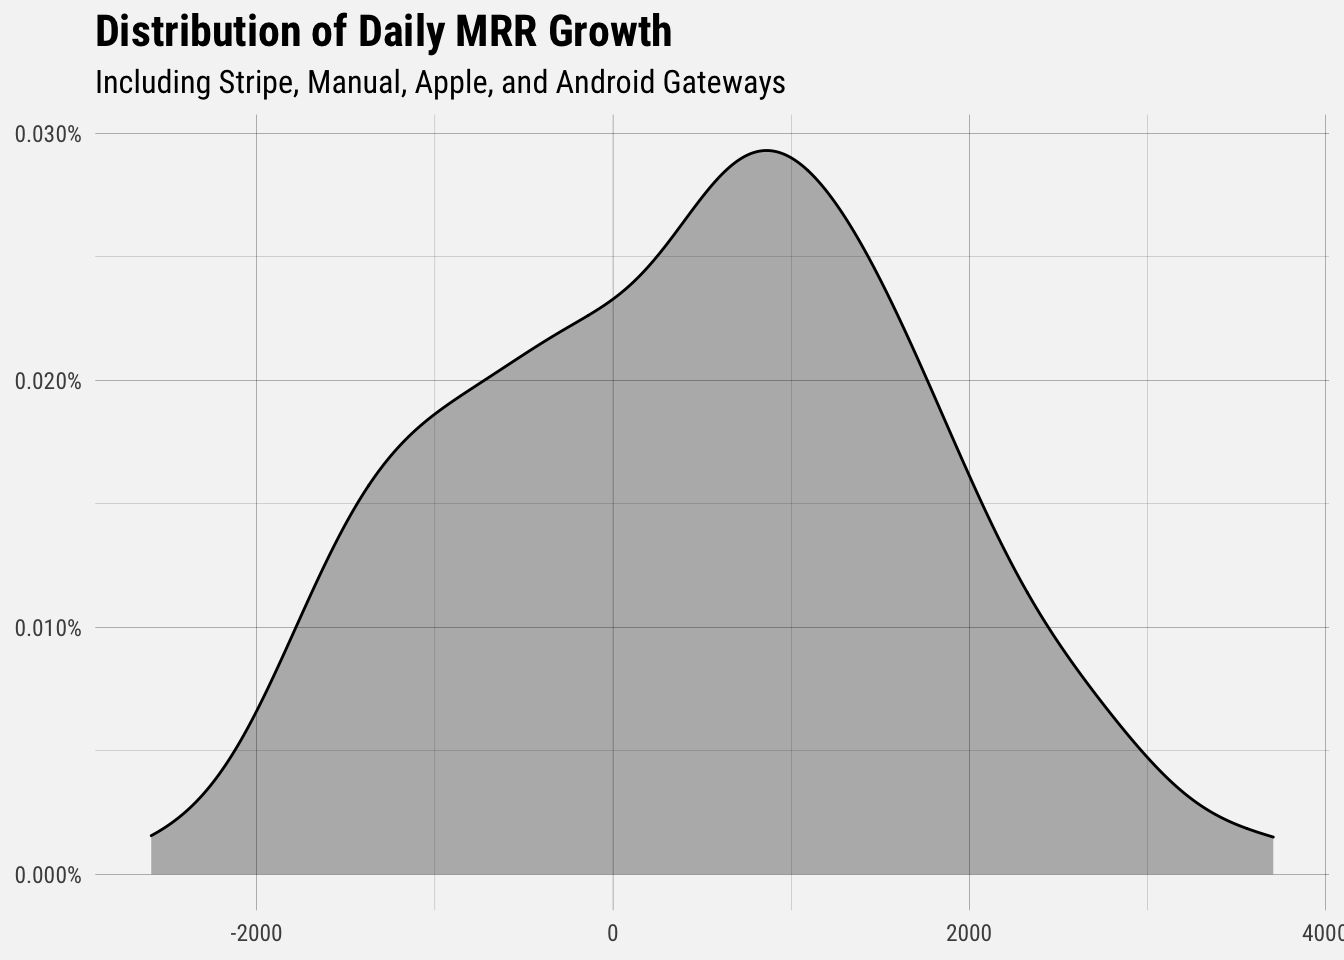
Great, now we can visualize the distribution of MRR growth. We will exclude December 1, which is a clear anomaly.
# get summary statistics
stat.desc(mrr$growth)
## nbr.val nbr.null nbr.na min max range
## 180.000 0.000 1.000 -6134.041 3707.186 9841.227
## sum median mean SE.mean CI.mean.0.95 var
## 74164.221 559.547 412.023 101.724 200.734 1862617.254
## std.dev coef.var
## 1364.777 3.312We can see that the average amount MRR has grown in the past 6 months is $412 per day. The median MRR growth per day is $560, and the standard deviation, the measure of variance from the mean, is $1365.
If we assume that daily MRR growth roughly follows a normal distribution, we can say that 95% of the time, daily MRR growth will fall between two standard deviations of the mean (-2106, 3003).
# filter out december 1
mrr <- mrr %>%
  filter(!is.na(growth) & date != "2018-12-01")

# upper bound
mean(mrr$growth) + (2 * sd(mrr$growth))
## [1] 3003# lower bound
mean(mrr$growth) - (2 * sd(mrr$growth))## [1] -2106We can visualize this in the graph of the distribution of revenue growth.
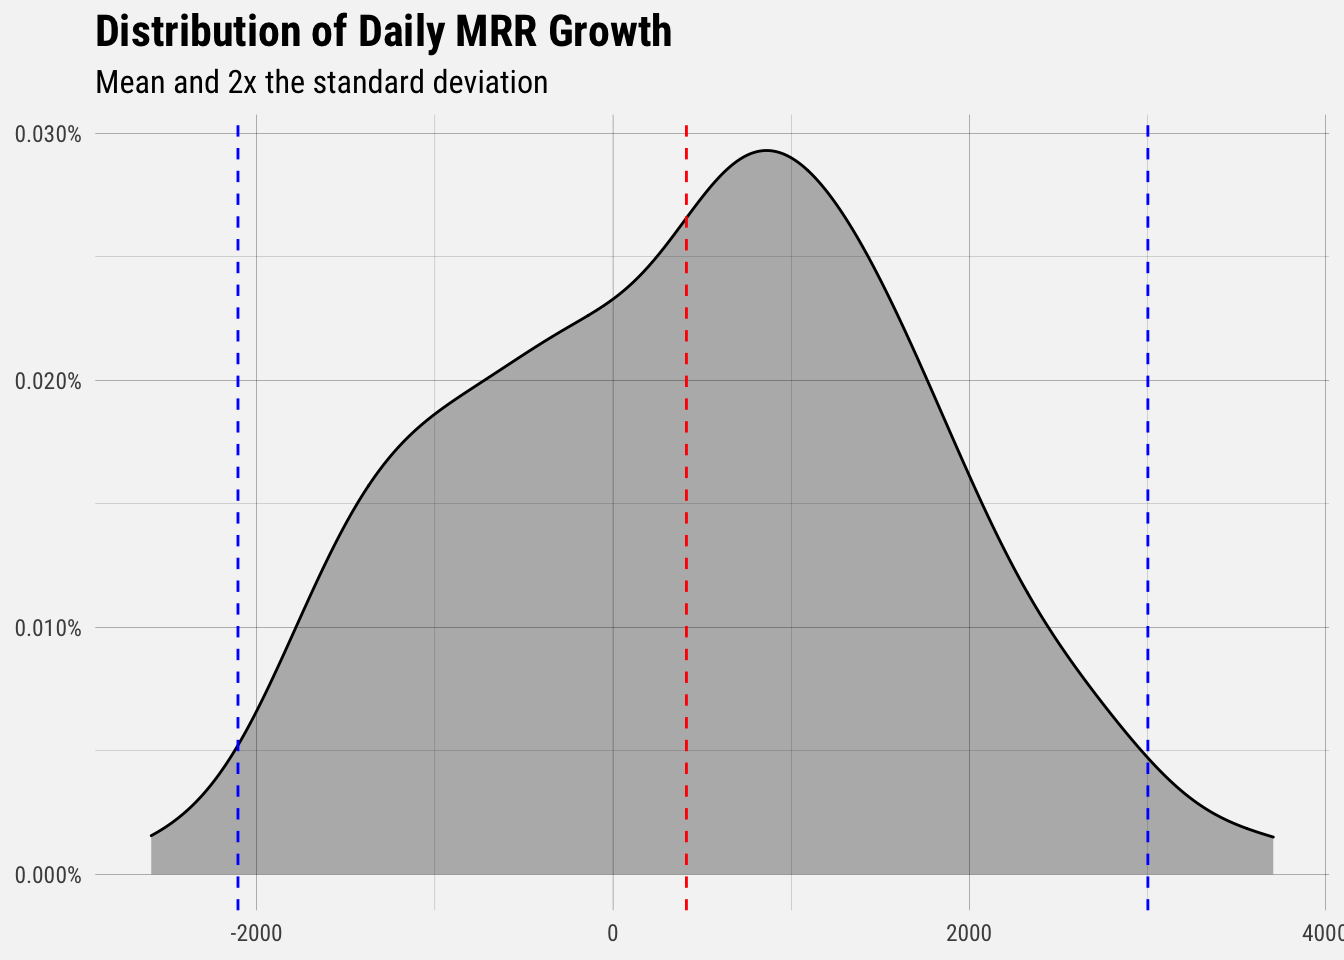
The red dotted line represents the average daily MRR growth, and the two dotted blue lines represent the values twice the standard deviation away from the mean. Around 95% of daily MRR growth should fall between the two dotted blue lines.