On May 3, we started putting all new-to-Buffer Pro trialists in New Publish. In this analysis, we will attempt to detect any significant effect that this change has had on Pro upgrades and Pro MRR. The goal of the Publish team is to have no significant negative impact on Pro upgrades or MRR.
Because there are known issues with trials data that are partially due to our business logic and Stripe implementation, we will focus on upgrades and MRR instead of trial conversions. I believe these are the metrics we care most about, and they will include the trialists.
Data Collection
Let’s start by collecting Pro MRR data. We will focus only on Stripe MRR, since New Publish mostly affects Stripe (web) users.
select
  date
  , sum(mrr_amount) as mrr
from dbt.stripe_mrr
where plan_id in ('pro_v1_yearly', 'pro_v1_monthly')
and date >= '2019-01-01'
group by 1
Pro MRR
We can quickly plot how Pro Stripe MRR has changed over the past few months.
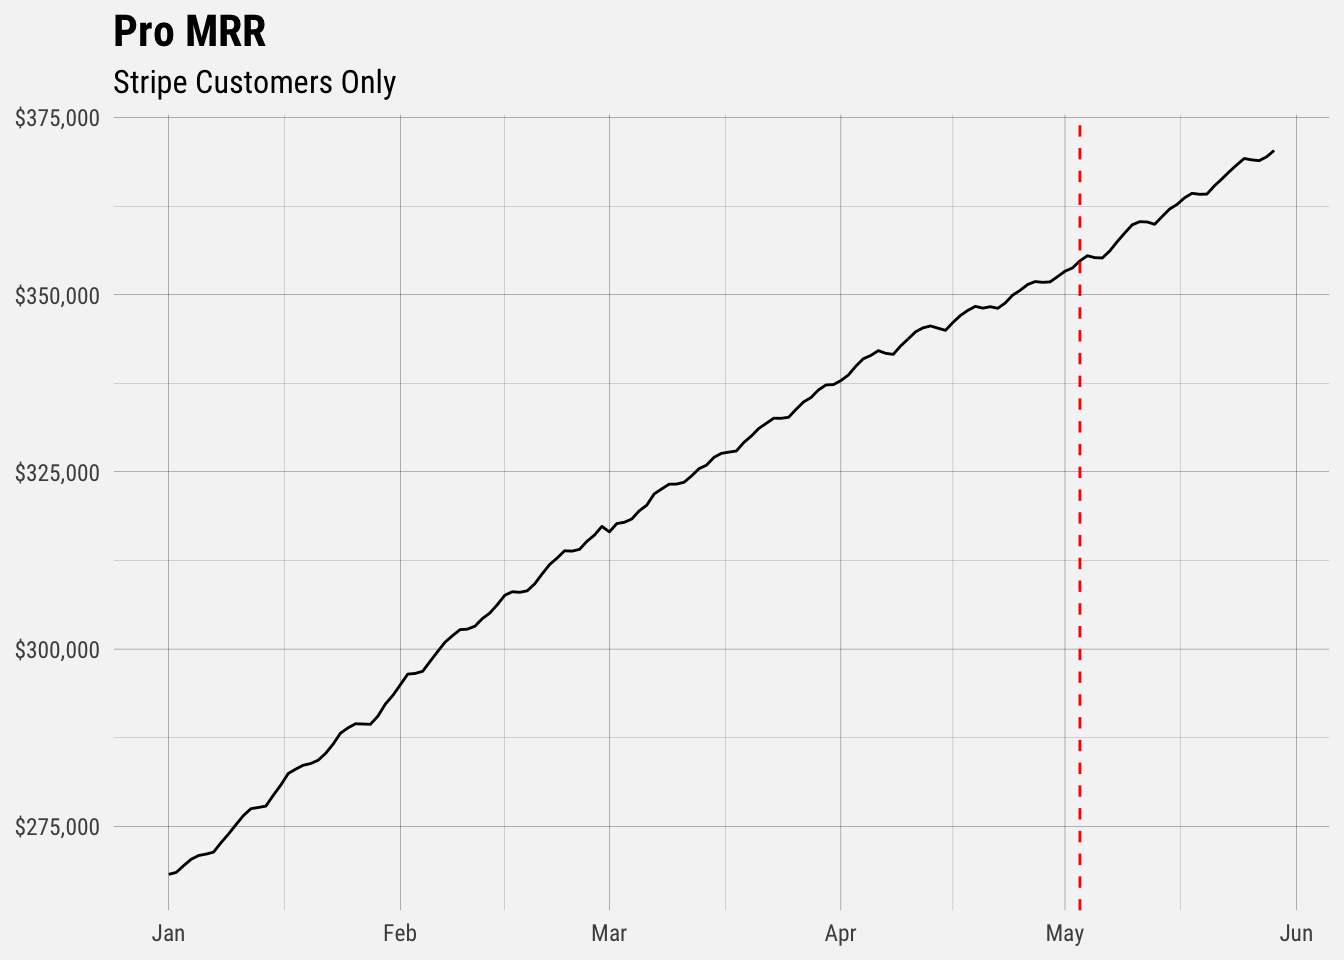
We can see that there is a roughly linear trend with a weekly seasonal effect. Let’s plot daily MRR growth over time.
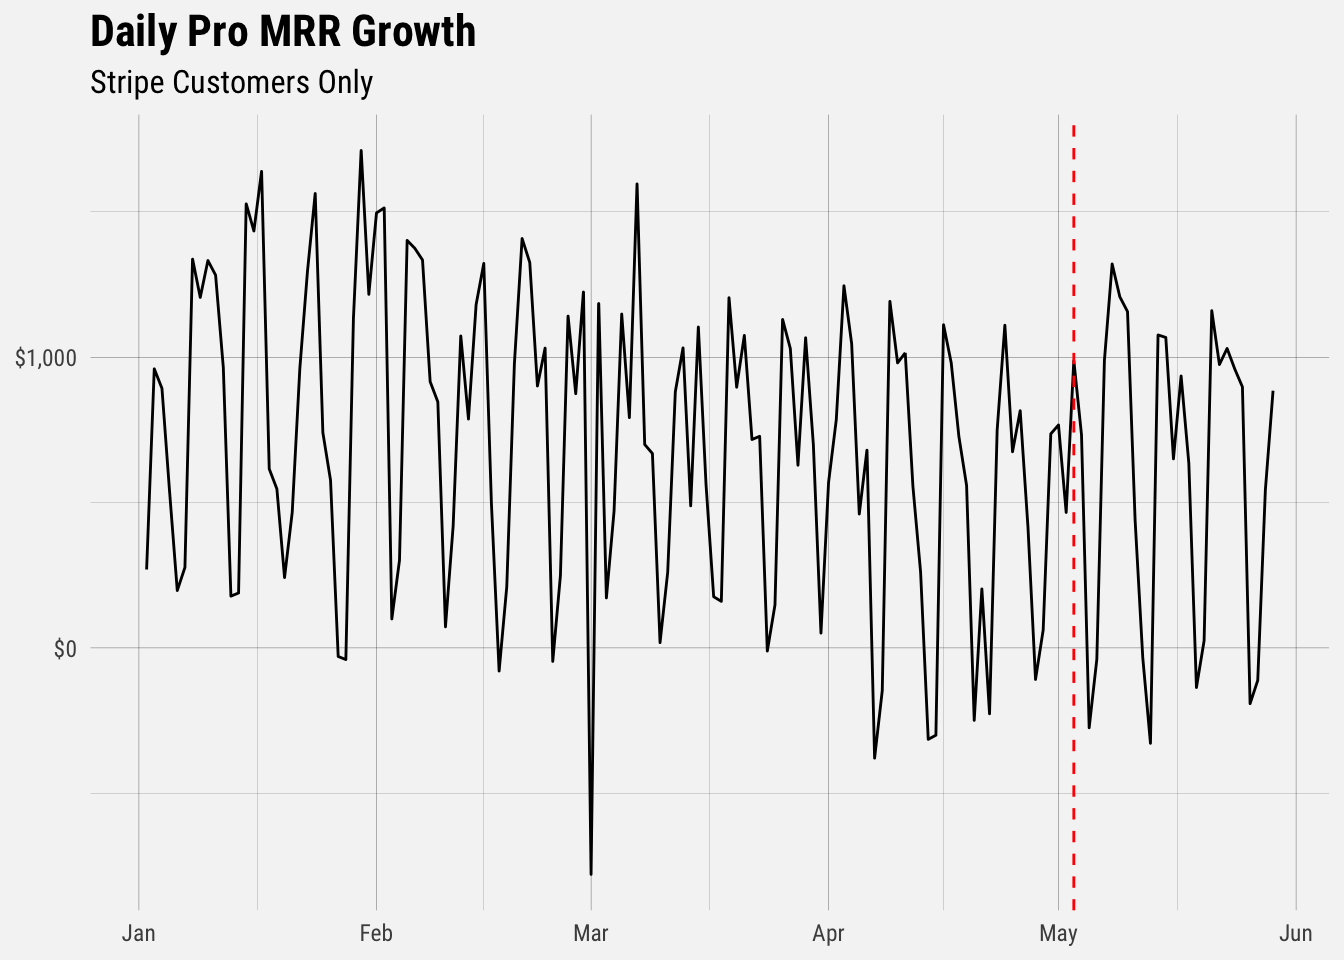
We can perform a Causal Impact analysis to see if there is evidence of a negative effect on Pro MRR growth.
To do this analysis, we look at Pro MRR growth before we started putting Pro trialists into New Publish and compare the forecast of what MRR growth likely would have been with the actual observed MRR values. The difference between the counterfactual (what MRR would have been without the survey) and the observed MRR values is our estimated effect size.
To perform inference, we run the analysis using the CausalImpact command.
# run analysis
impact <- CausalImpact(mrr_ts, pre.period, post.period, model.args = list(niter = 5000, nseasons = 7))

# plot impact
plot(impact) +
  labs(title = "Impact on Pro MRR Growth",
       subtitle = "There is no evidence of a negative impact on Pro MRR Growth") +
  buffer_theme()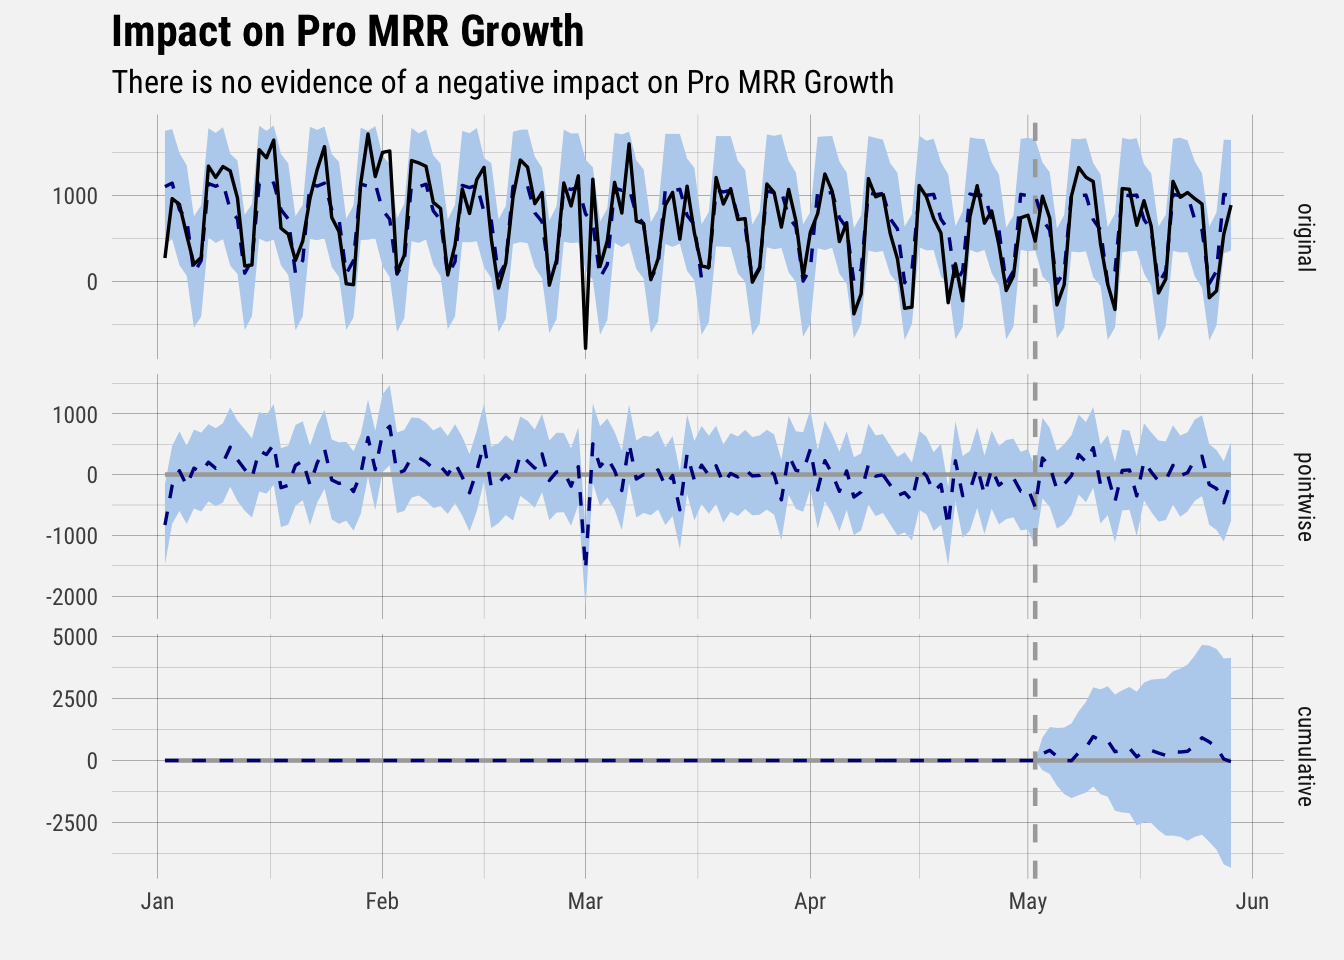
As of May 29, there is not sufficient evidence to suggest that there has been a negative impact on Pro MRR growth.
Pro Upgrades
Let’s now look only at the number of Pro subscriptions being created.
select
  s.id as subscription_id
  , date(s.created_at) as created_date
  , s.plan_id
from dbt.stripe_subscriptions as s
where s.created_at >= '2019-01-01'
and s.plan_id in ('pro_v1_monthly', 'pro_v1_yearly')
and s.successful_charges >= 1
## `summarise()` ungrouping output (override with `.groups` argument)## `geom_smooth()` using formula 'y ~ x'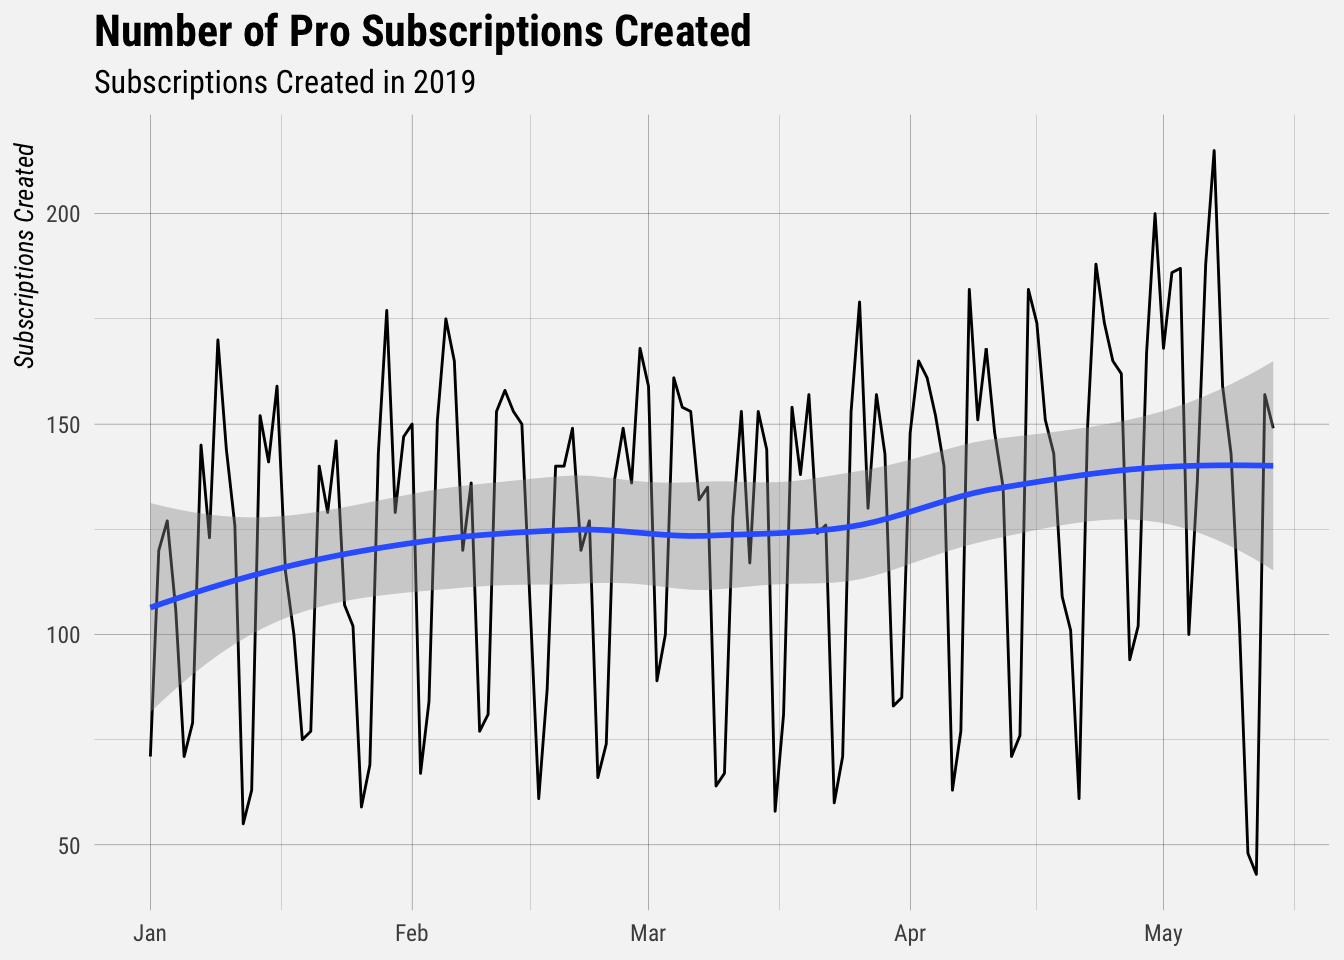
We can run a similar causal impact analysis to see if there has been a negative effect on Pro upgrades.
# run analysis
impact <- CausalImpact(upgrade_ts, pre.period, post.period, model.args = list(niter = 5000, nseasons = 7))

# plot impact
plot(impact) +
  labs(title = "Impact on Pro Upgrades",
       subtitle = "There is no evidence of a negative impact on Pro Upgrades") +
  buffer_theme()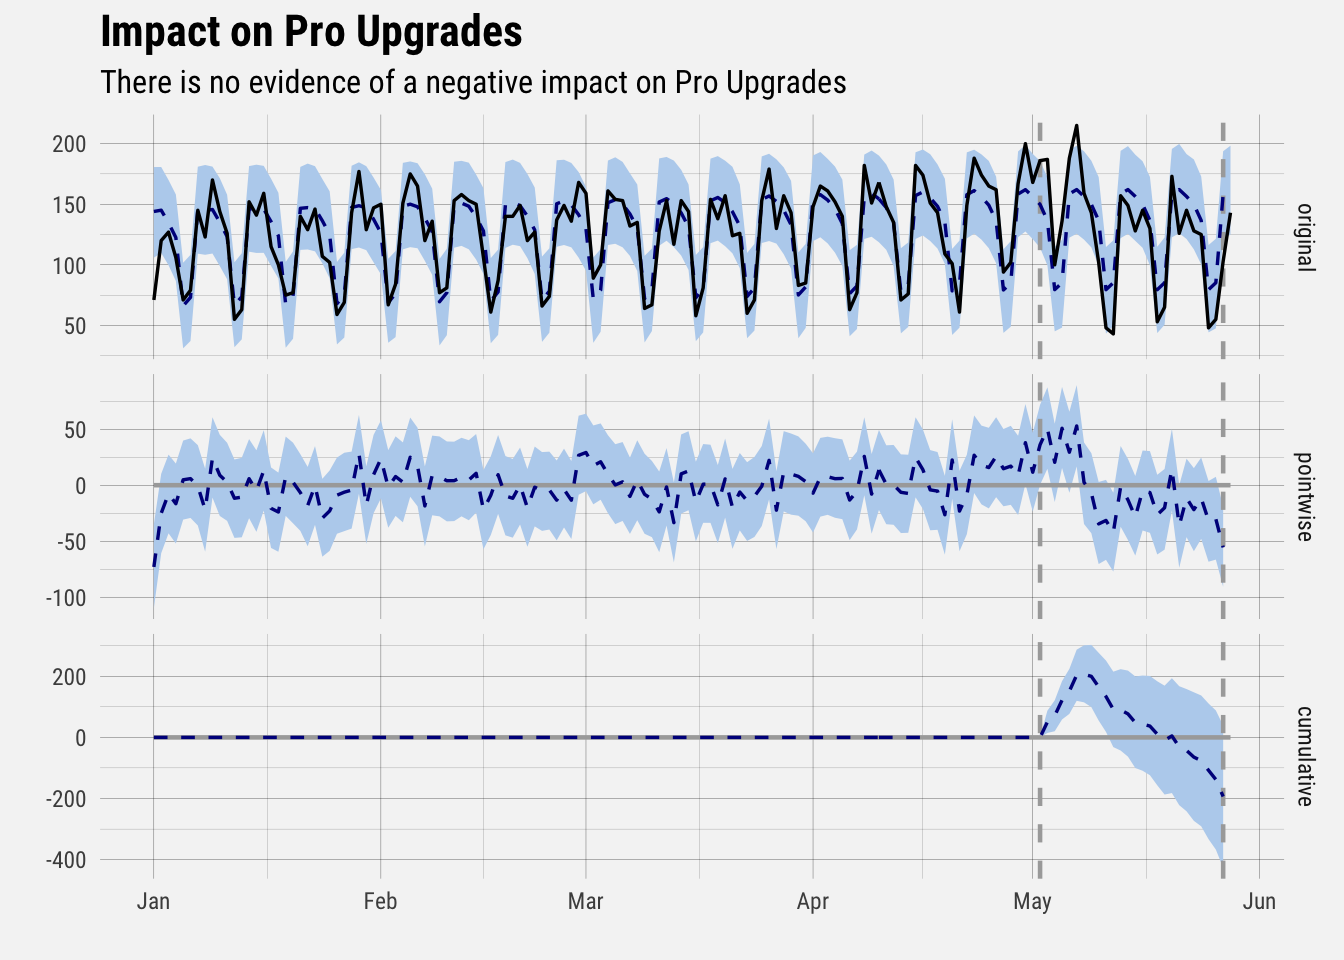
As of May 29, there is not sufficient evidence to suggest that there has been a negative impact on Pro upgrades.