In this analysis we’ll examine some of the effects that the introduction of the Premium plan has had. We’ll try to gauge the impact on MRR, and we’ll also examine the churn rates of the new Premium plans and compare them to that of the Pro and Small Business plans.
Data Collection
Let’s start by collecting all Business MRR values from the past year.
select
  s.date
  , s.plan_id
  , p.simplified_plan_id as plan
  , sum(s.mrr_amount) as mrr
from dbt.stripe_mrr s
left join dbt.plans as p
  on s.plan_id = p.id
where s.date > current_date - 365
and p.simplified_plan_id = 'business'
group by 1,2,3
Impact on MRR
Let’s plot Business MRR over the past year. We introduced the Premium plan on March 21, 2019.
## `summarise()` ungrouping output (override with `.groups` argument)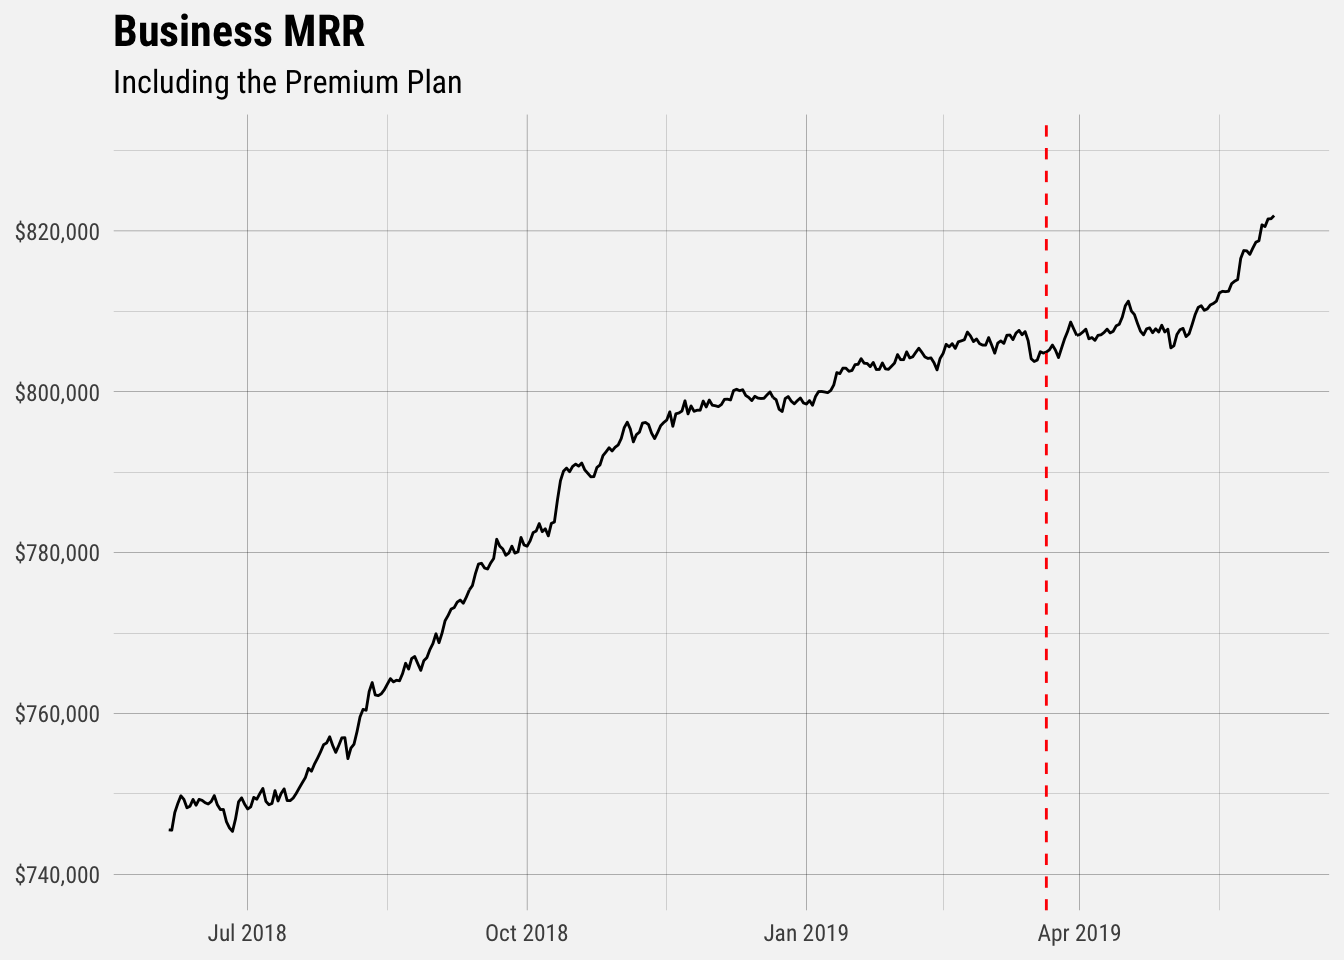
We can see that there is an inflection point around May 8, after which Business MRR grew much more quickly. Interestingly, we started sending Business trials to New Publish on May 8. What if we separated Premium MRR?
## `summarise()` regrouping output by 'date' (override with `.groups` argument)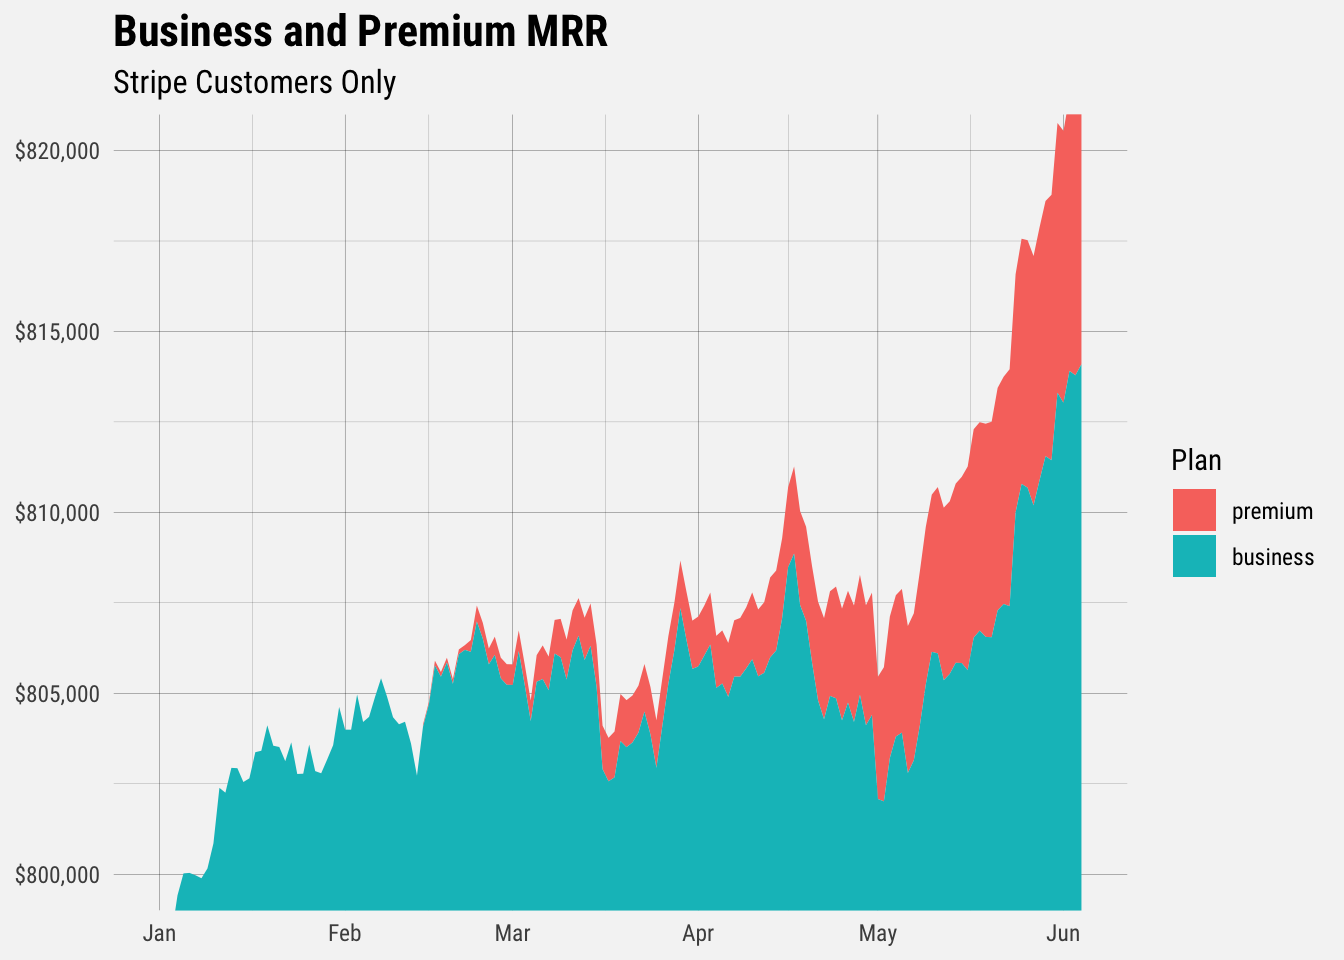
We can see that the premium plan has certainly contributed to the growth in Business MRR. Let’s look at the Business MRR plot without the premium plan.
## `summarise()` ungrouping output (override with `.groups` argument)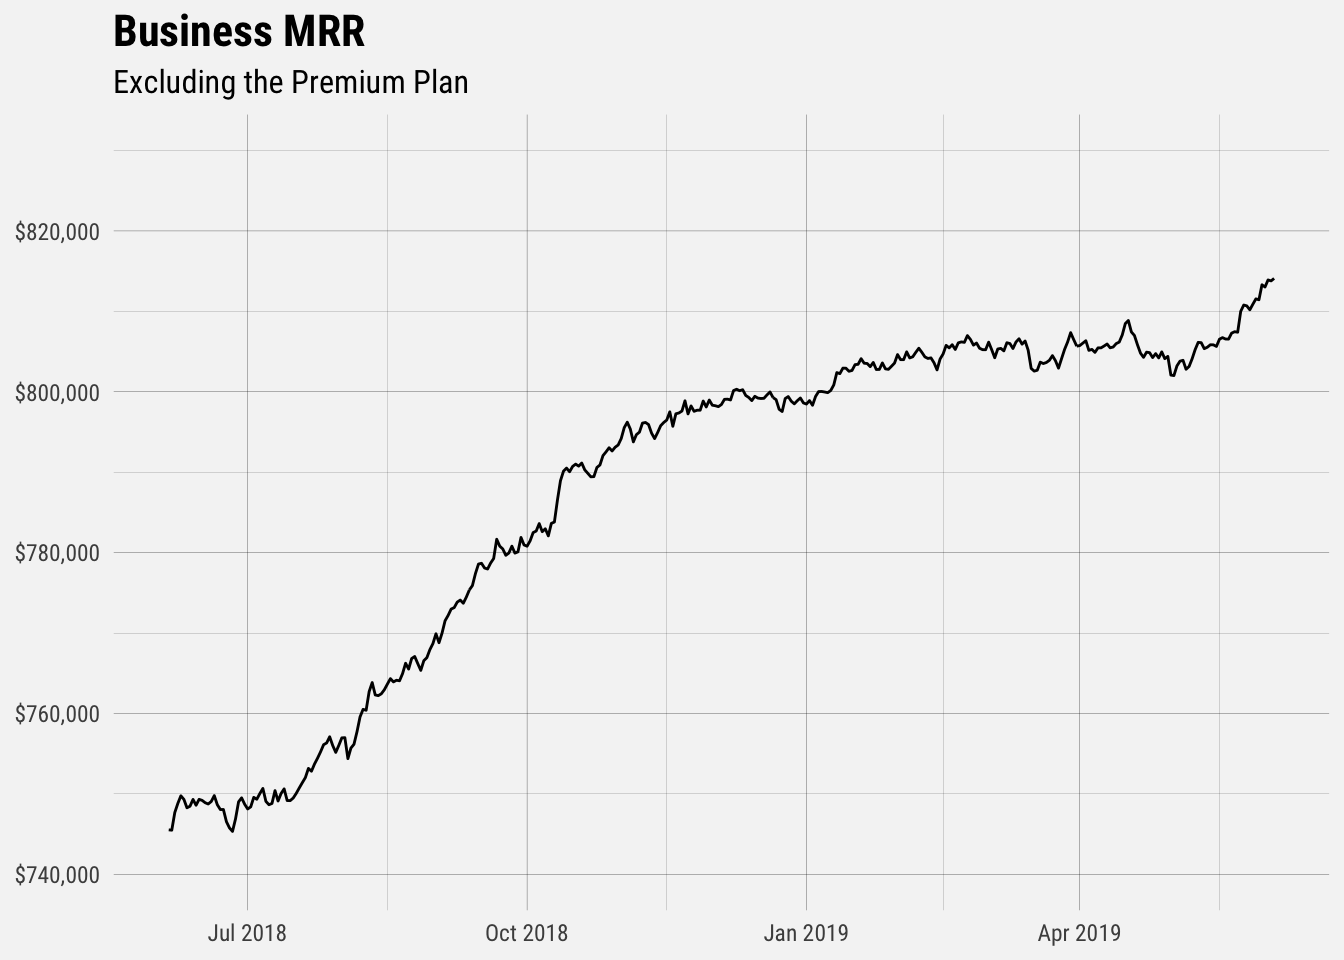
We can see that it still starts to grow significantly after May 8, but not as much as it did with the premium plan. It doesn’t seem like the Premium plan is cannibalizing the small business plan at all! It definitely isn’t cannibalizing Pro MRR, which is still growing linearly.
Churn Rates
To analyze churn rates, we’ll use a technique called survival analysis. This method is very useful in modeling and analyzing the time it takes for a specific event to occur, churn in this case.
It’s particularly useful in this case because the data is censored – there must be subscriptions that will churn in our dataset that haven’t yet. This is called censoring, and in particular right censoring.
Right censoring occurs when the date of the event is unknown, but is after some known date. Survival analysis can account for this kind of censoring. There is also left censoring, for example when the date the subscription was created is unknown, but that is less applicable to our case.
The survival function, or survival curve, (S) models the probability that the time of the event (T) is greater than some specified time (t) and is composed of:
The underlying Hazard function (how the risk of churn per unit time changes over time at baseline covariates).
The effect parameters (how the hazard varies in response to the covariates).
Let’s start by looking only at the monthly plans. The annual Premium customers haven’t had as much opportunity to churn just yet.
select
  s.id as subscription_id
  , s.plan_id
  , s.billing_interval
  , date(s.created_at) as created_at
  , date(s.canceled_at) as canceled_at
  , datediff(day, s.created_at, s.canceled_at) as subscription_length
from dbt.stripe_subscriptions as s
where s.created_at >= (current_date - 365)
and s.plan_id in ('pro_v1_monthly', 'pro_v1_yearly',
                  'business_v2_small_monthly', 'business_v2_small_yearly',
                  'premium_business_v1_monthly', 'premium_business_v1_yearly')
and s.successful_charges >= 1
group by 1,2,3,4,5,6
There are around 42 thousand subscriptions in this dataset.
# count subscriptions
table(subs$plan_id)
##
## business_v2_small_monthly business_v2_small_yearly
## 4707 1383
## premium_business_v1_monthly premium_business_v1_yearly
## 160 73
## pro_v1_monthly pro_v1_yearly
## 26225 10935# fit survival data using the Kaplan-Meier method
surv_object <- Surv(time = monthly$time, event = monthly$churned)
# peek at the survival object
head(surv_object)## [1] 0 653+ 892+ 640+ 812+ 617+Now we can fit the curve for the monthly plans.
# fit curve for monthly plans
month_fit <- survfit(surv_object ~ plan_id, data = monthly)
Let’s plot the survival curves for each plan now.
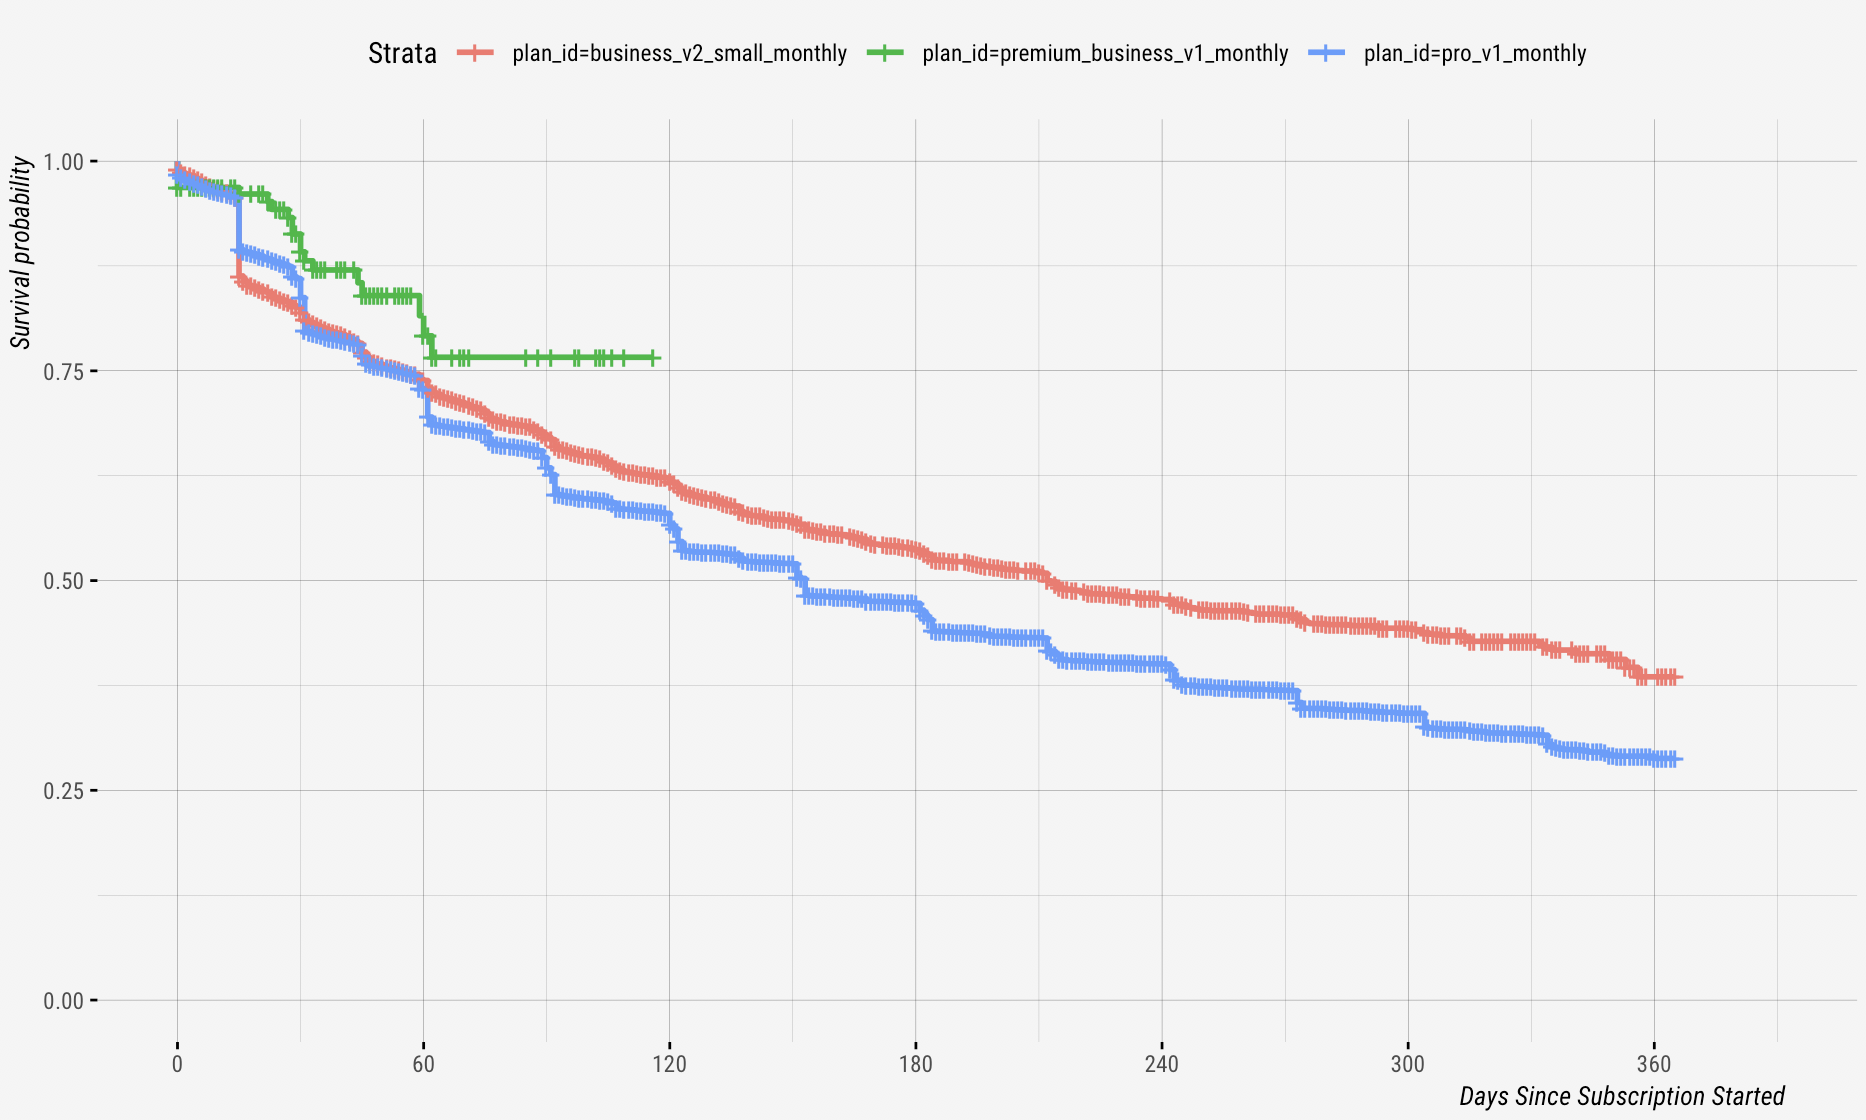
This simple plot presents estimates of survival probability depending on days from starting a subscription by plan type. The plot indicates that Pro monthly customers churn more quickly than small business customers. However it’s interesting to see that Premium customers are churning at significantly lower rates than small business customers! The Premium plan was only introduced recently, so we’ll need to keep an eye on these survival curves as more users subscribe to the plan.