In this analysis we will explore the behavior of Premium trialists. We’ll try to see which features are used most and which correlate most with converting. These are the feature actions that we will examine:
- Connecting a profile
- Creating a post
- Using Instagram first comment
- Viewing the week or month view
- Viewing post analytics
- Viewing overview analytics
- Using the browser extension
- Using a mobile app
- Creating a draft
- Using Shop Grid
Analytics usage is more common among Premium trialists than Pro trialists. Usage of the different features is correlated, and usage of each feature is correlated with trial conversion.
Data Collection
We need to find the events in the actions_taken table that correspond to each of these actions. First we’ll collect all of the trialists that were on a Pro trial in the past year, then join the relevant updates, profiles, and actions_taken records. The SQL query used is a big one, so the code has been hidden.
There are over 3 thousand Premium trial records to work with. The trials started after August 1, 2018 and before August 2, 2019.
Data Tidying
Next we’ll create a couple new fields that tell us some more information about the trialist.
# determine if started at signup
trials <- trials %>%
  mutate(started_at_signup = trial_start == signup_date,
         used_first_comment = updates_with_first_comment > 0,
         used_calendar = calendar_actions > 0,
         viewed_post_analytics = viewed_posts > 0,
         viewed_overview_analytics = viewed_overview > 0,
         exported_csv = exported_analytics > 0,
         created_draft = draft_created > 0,
         used_shop_grid = shop_grid > 0,
         shared_update = updates > 0,
         added_profile = profiles > 0,
         used_extension = extension_updates > 0,
         used_mobile = mobile_updates > 0)
Exploratory Analysis
Let’s explore some of these metrics to get a better idea of how people are making use of the Premium trial.
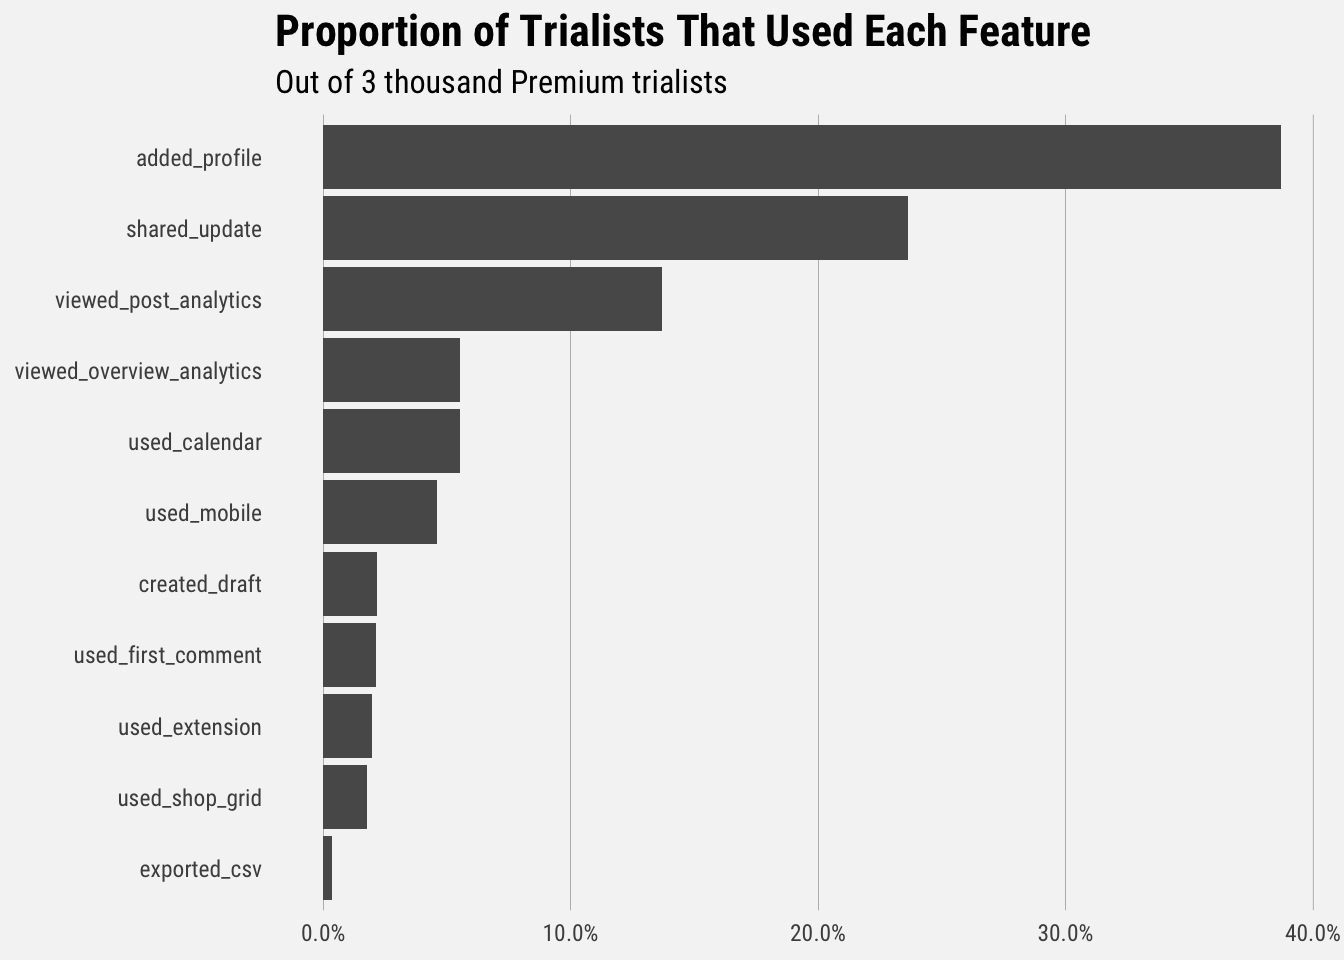
Analytics was more widely used in Premium trials. Less than 10% of Pro trialists viewed post analytics. Let’s take a look at which features are correlated with each other.
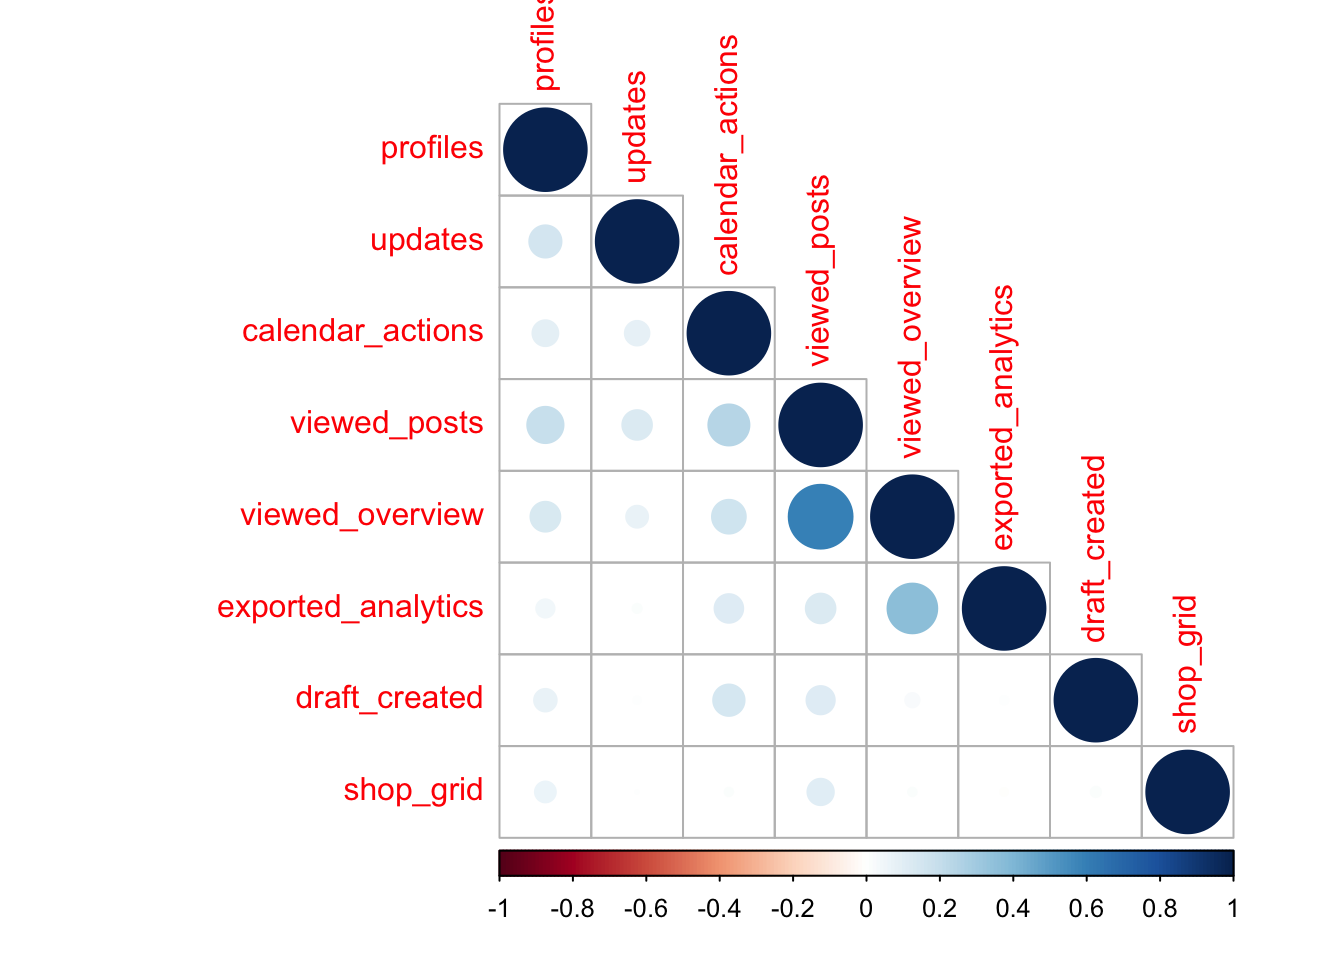
The number of profiles is most strongly correlated with the number of updates created, which makes sense. It is also positively correlated with viewing post analytics and overview analytics. Creating updates is correlated with viewing post analytics, which also makes sense given that updates and profiles are correlated. Viewing the calendar is correlated with viewing analytics and creating drafts. Viewing post analytics is naturally strongly correlated with viewing overview. Viewing overview analytics is strongly correlated with exporting a csv from analytics. Using shop grid is weakly correlated with viewing post analytics.
Now we’ll look at each feature individually. We’ll start with the number of profiles trialists had. Note that they could have added these profiles before the trial started, but not after it ended.
Profiles Added
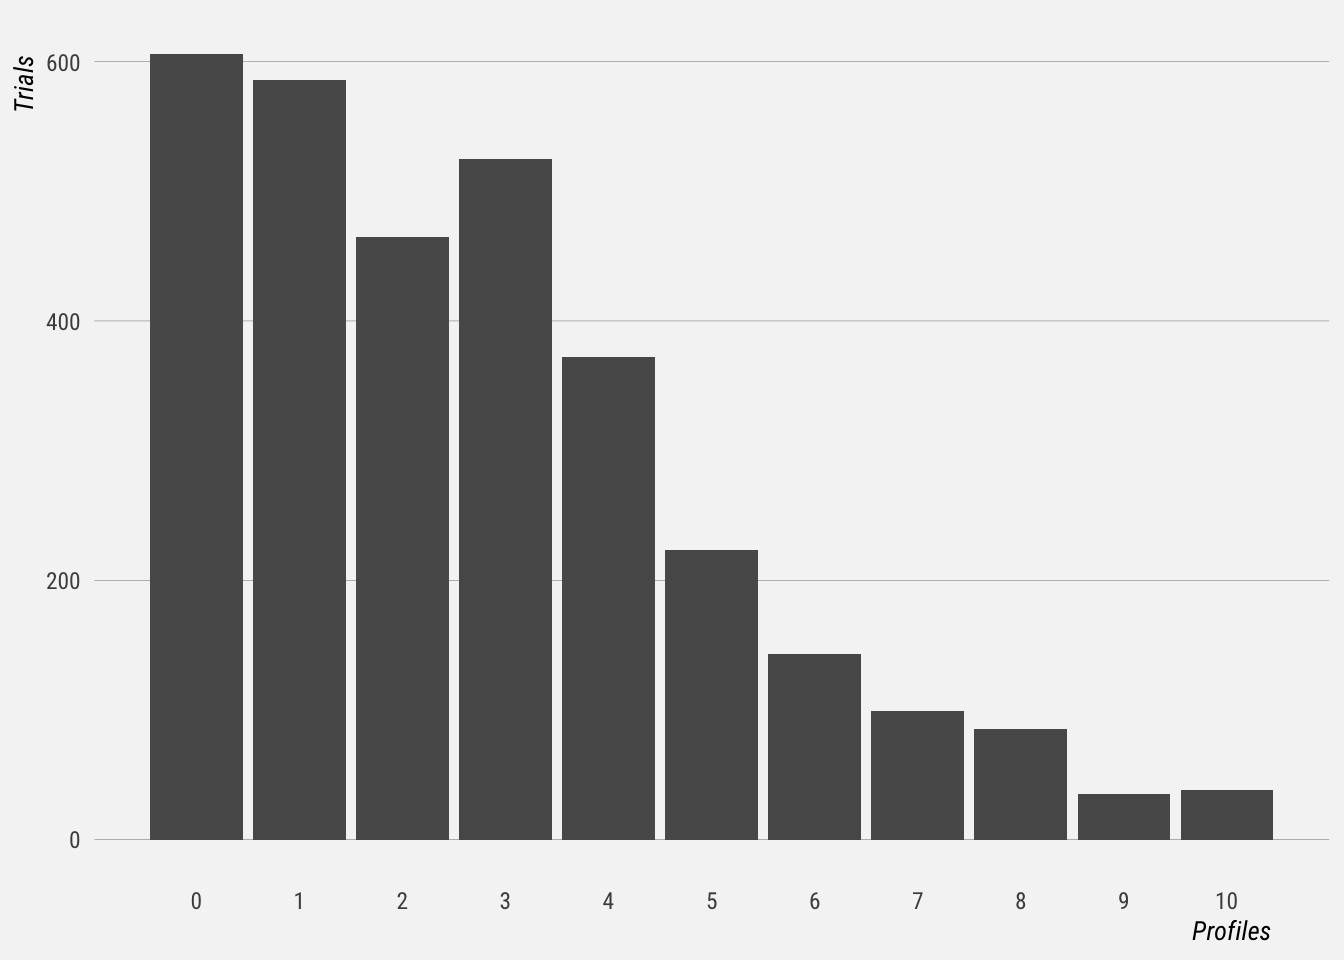
We see here that most trialists added between 0 and 5 profiles. This distribution is similar to that of Pro trialists. Let’s see how the number of profiles connected correlates with conversion rates.
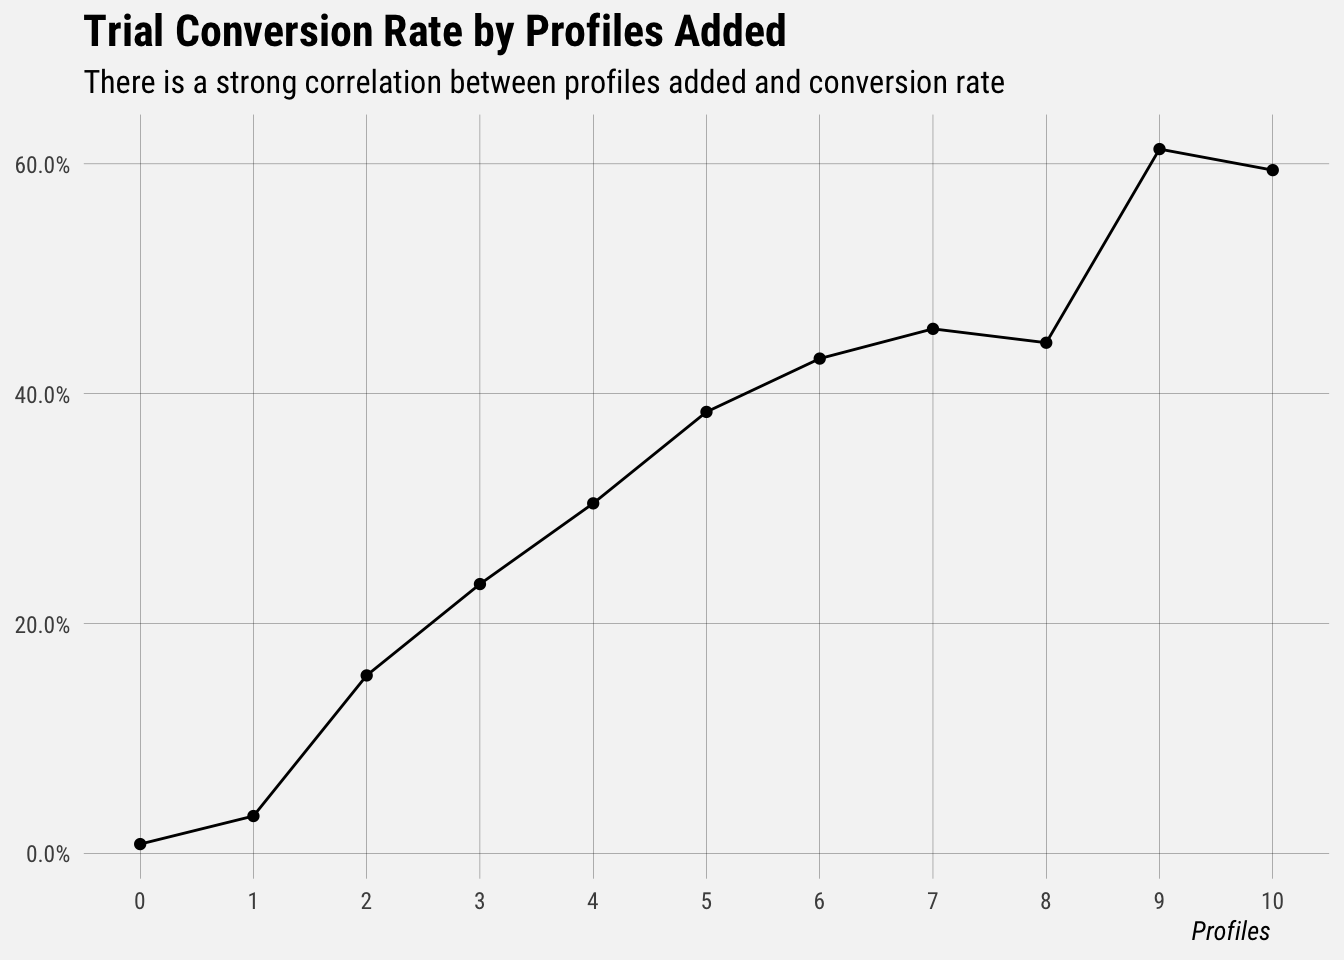
As the title states, there is a strong positive correlation between the number of profiles added and the trial conversion rate. The relationship is roughly linear between adding the second and sixth profile. After the sixth profile, the returns in terms of conversion rate diminish to nothing.
Posts Created
Now let’s look at the distribution of the number of updates sent. Because this distribution is more continuous and long-tailed, we will “bin” the number of updates into buckets.
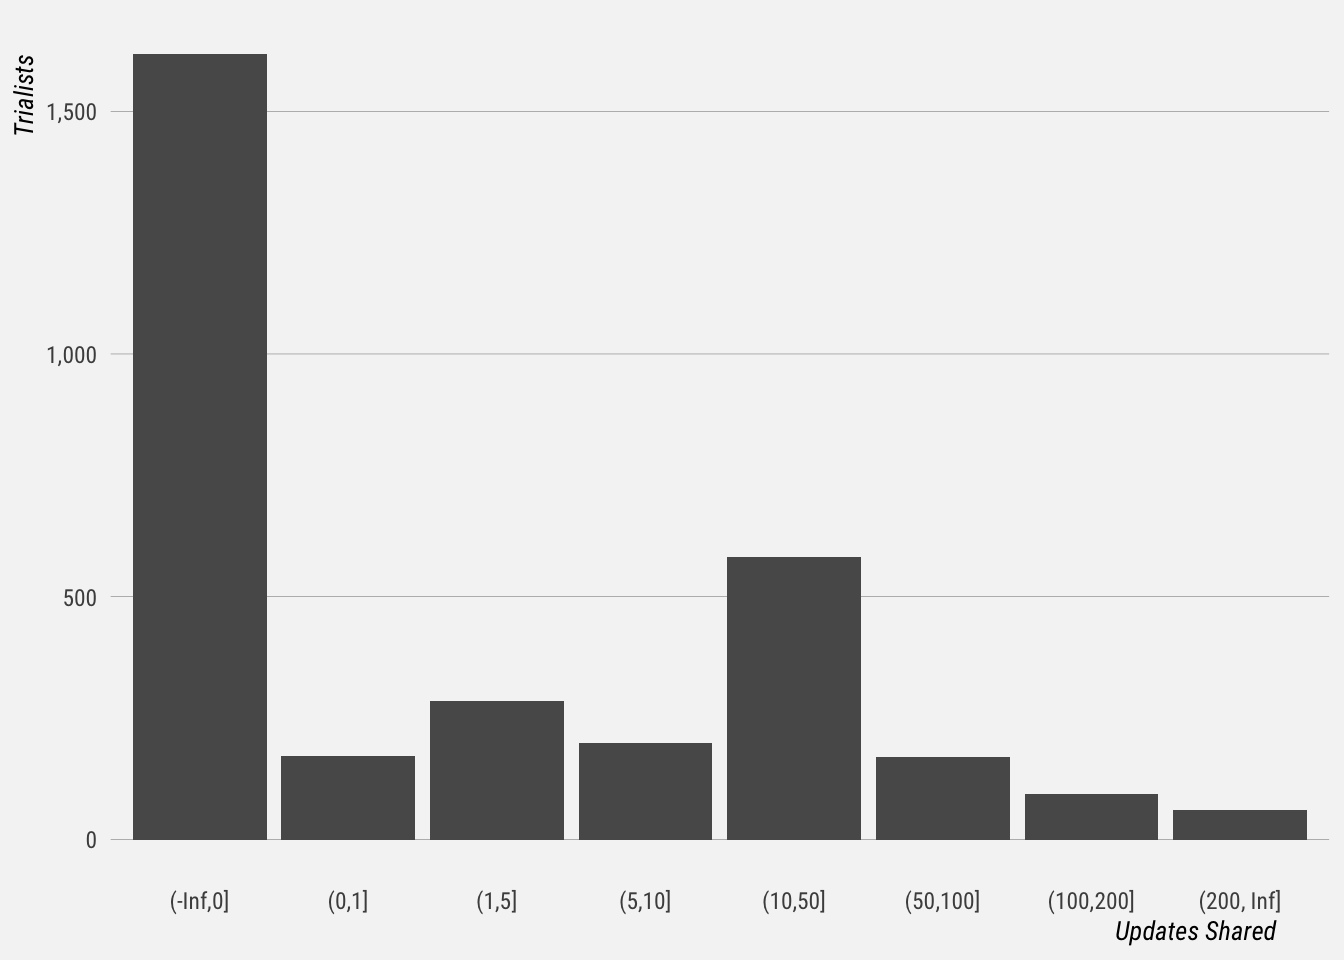
We can see here that many trialists didn’t create any updates. For those that did, the biggest bucket is the 11-50 update range, followed by the 2-5 range. This is similar to Pro trialists.
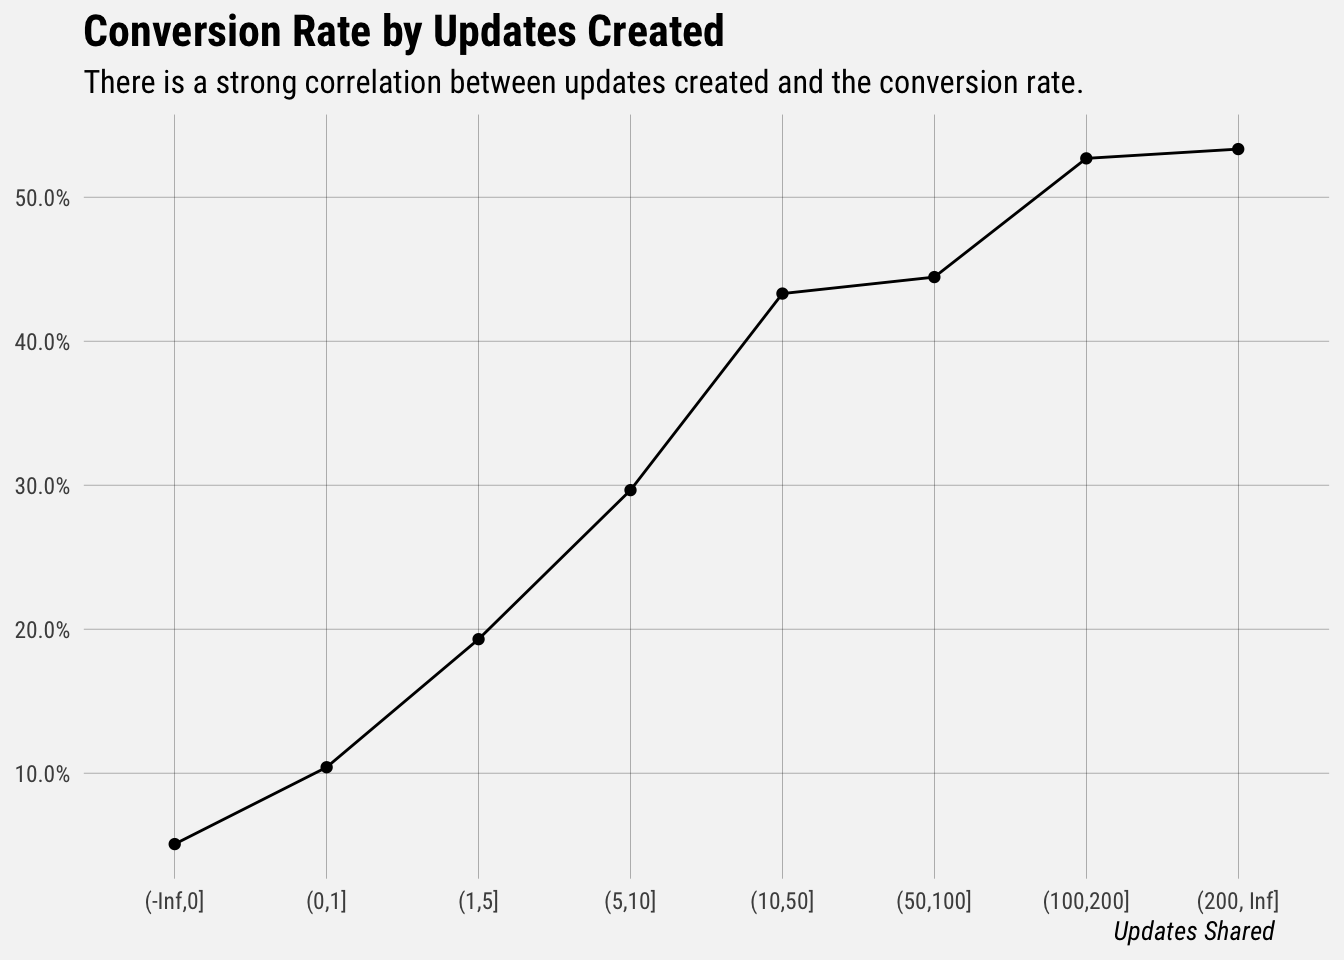
We can see again that there is a strong positive correlation between posts created and the conversion rate. The correlation weakens after 50 updates have been created. Let’s take the same approach for posts created from the extension.
Extension Usage
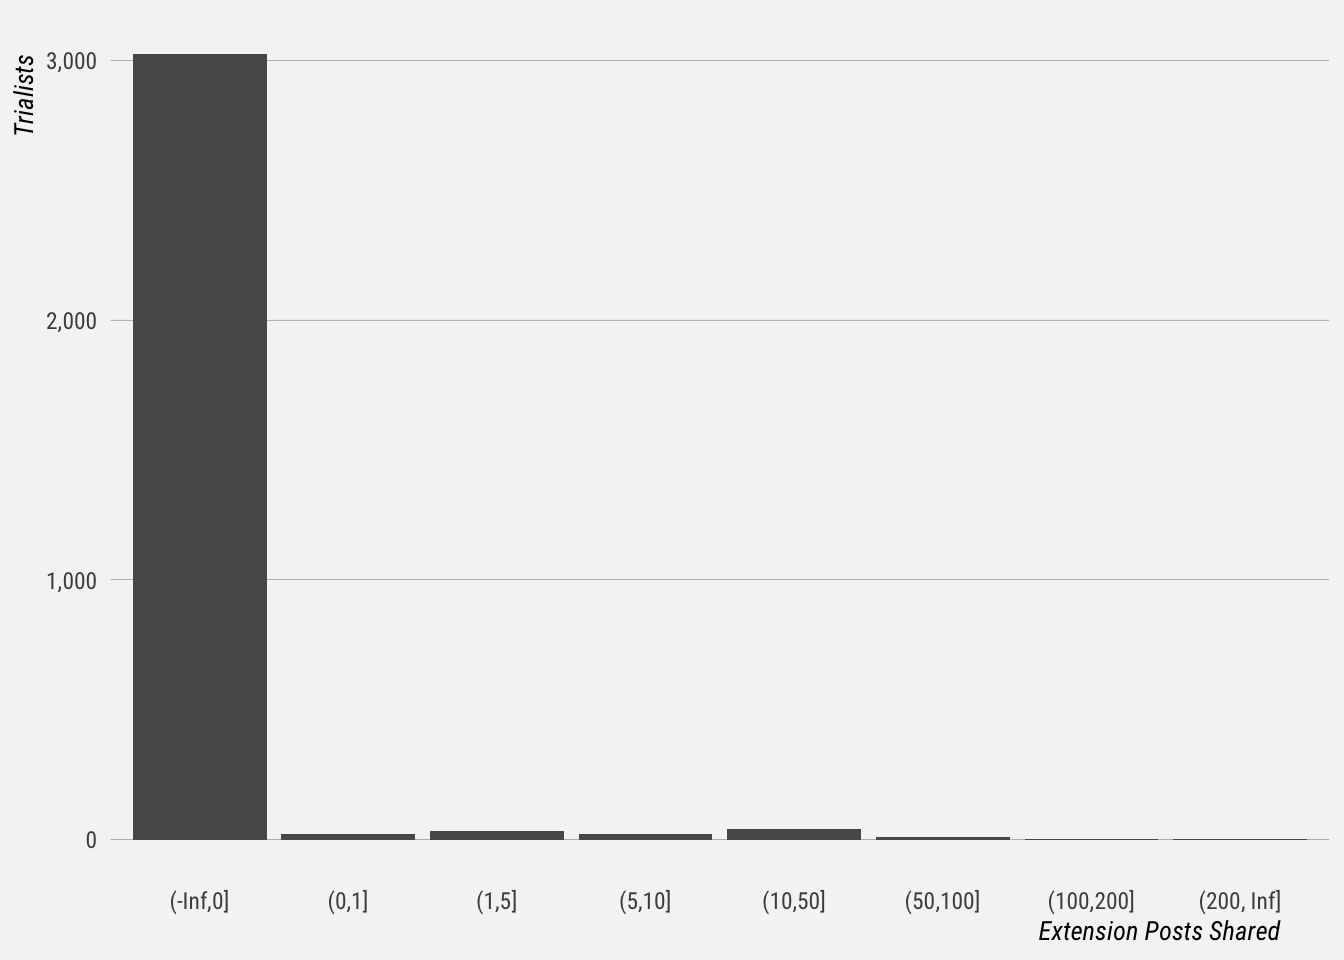
Ok, most trialists didn’t make full use of the extension. Did usage correlate with a higher probability of converting?
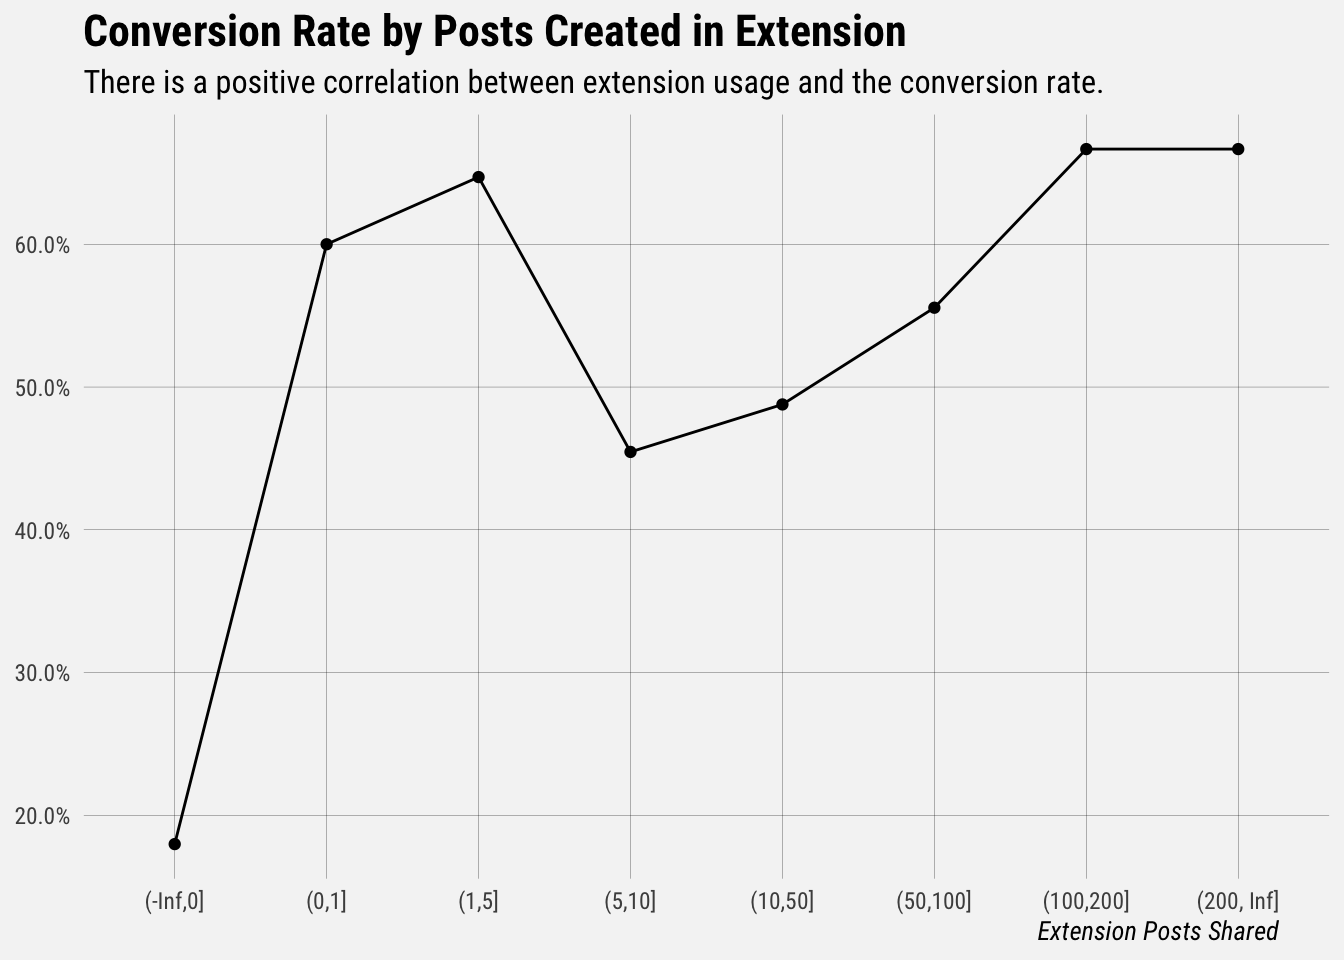
Wow. Using the extension just once increased the likelihood of conversion by 200%!
Mobile Usage
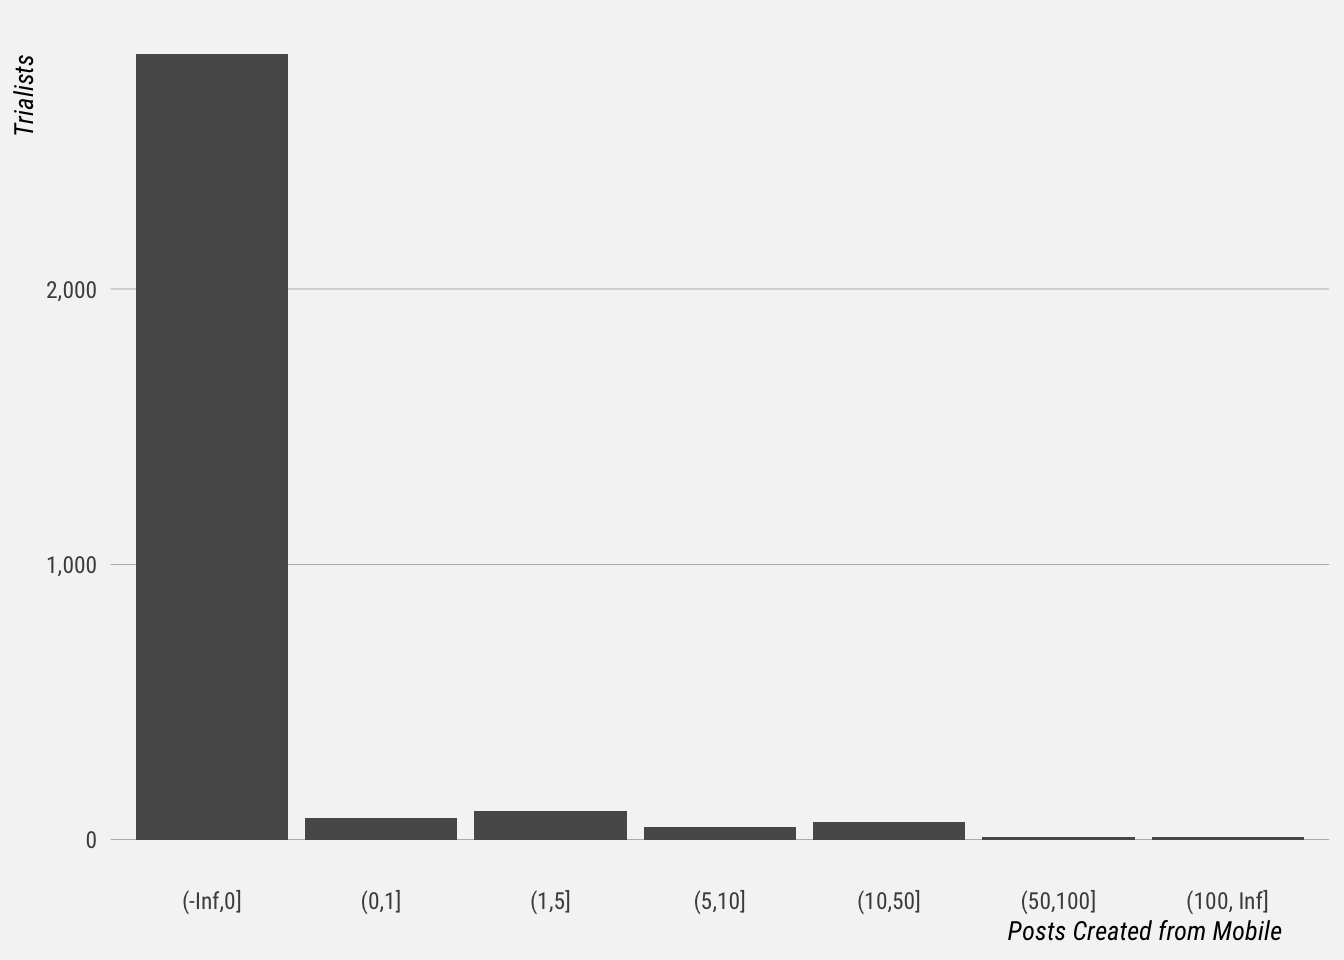
Again, relatively few users are taking advantage of the mobile apps.
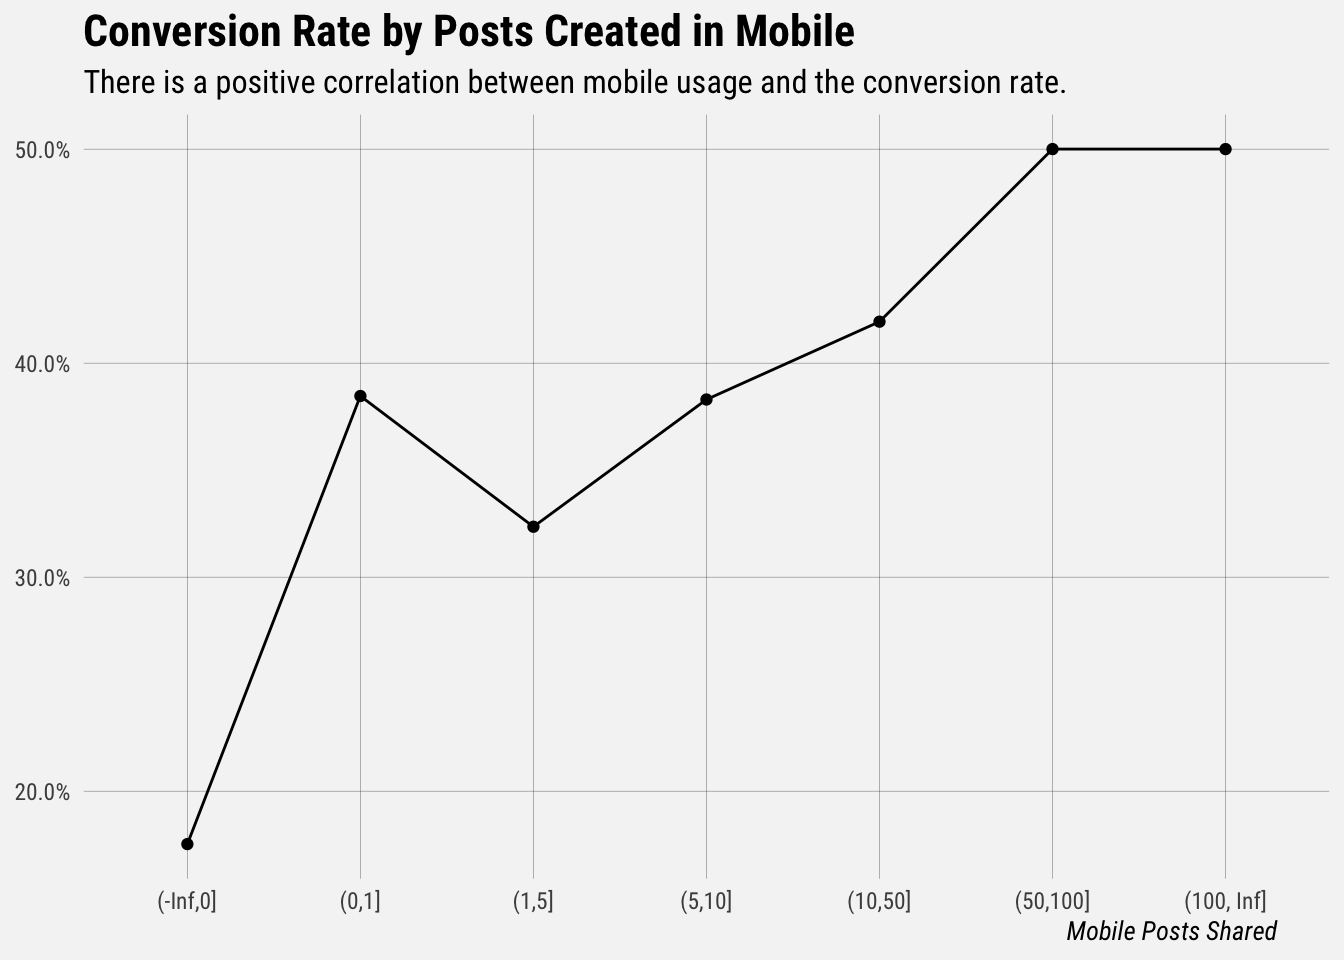
Those that do use mobile are much more likely to convert.
Post Analytics
Now let’s see how many Premium trialists view post analytics.
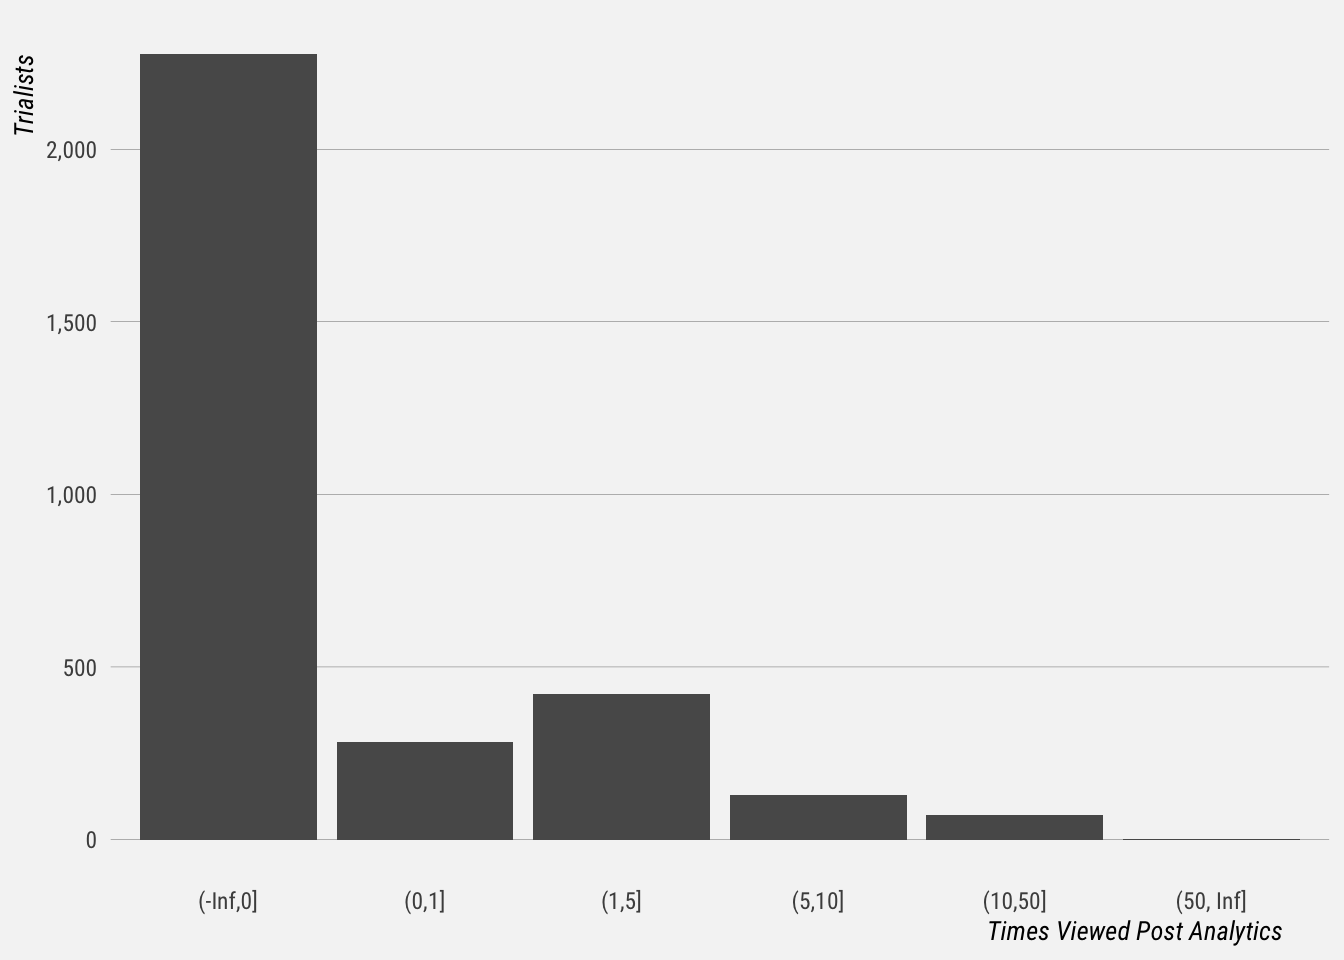
We can see here that most people did not look at the Posts tab in Analytics. Let’s see if there is any correlation between viewing the Posts tab and converting.
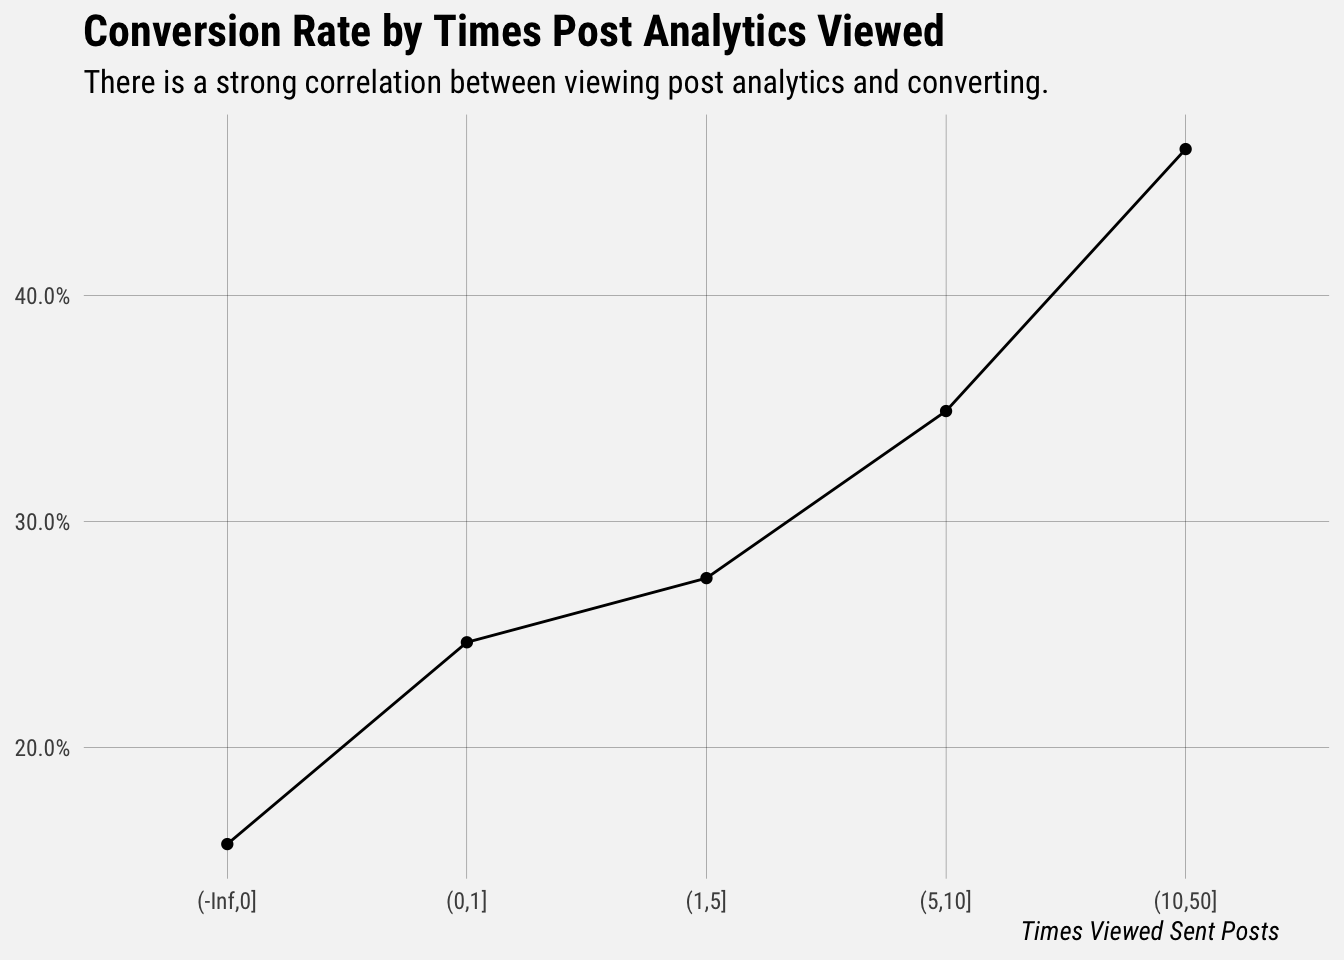
There is a positive correlation between viewing post analytics and converting.
Overview Analytics
Now let’s see how many Premium trialists view Overview analytics.
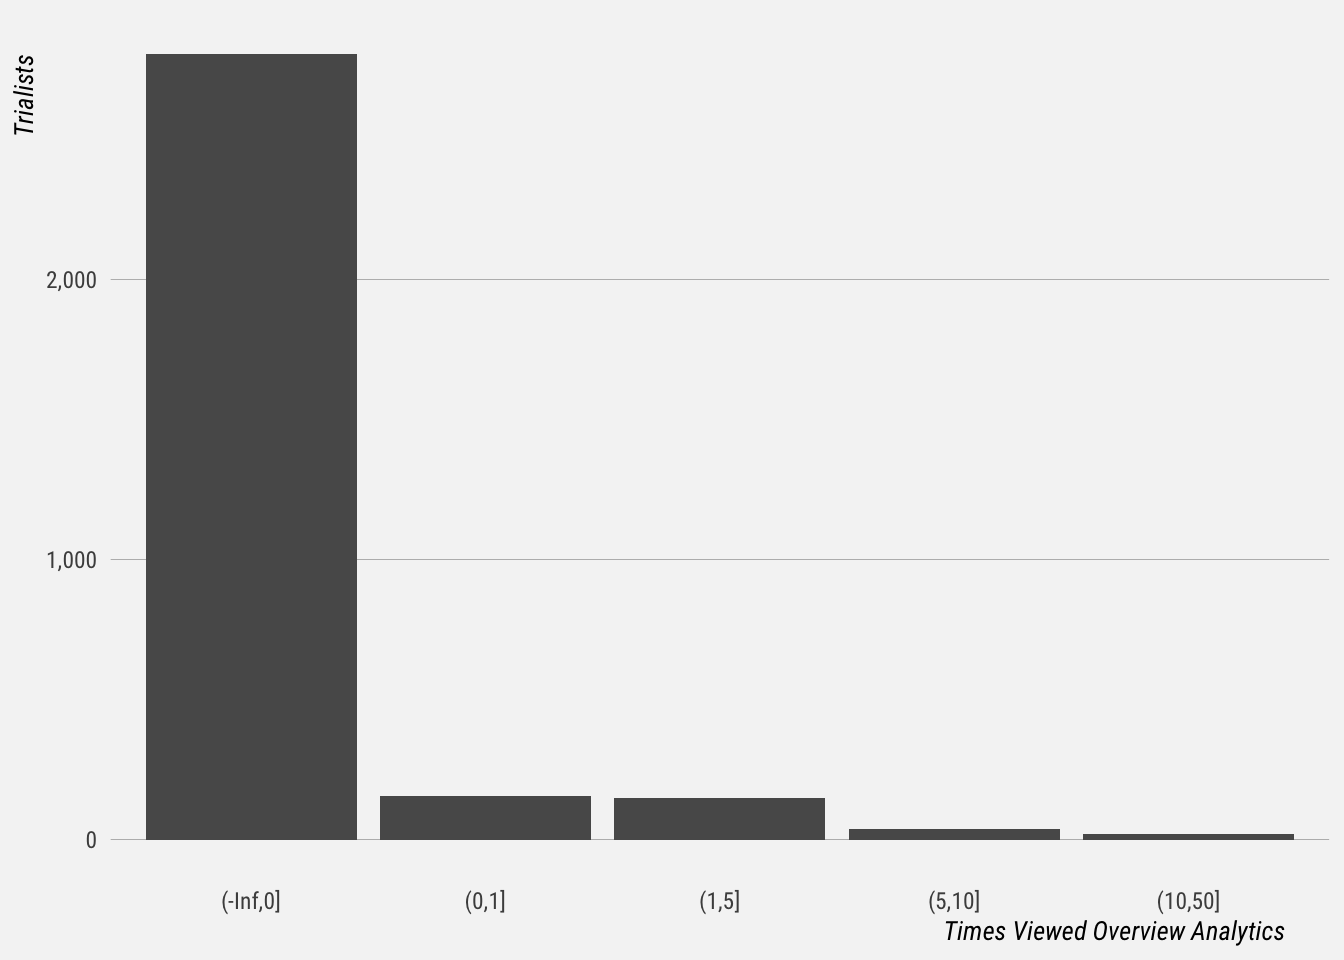
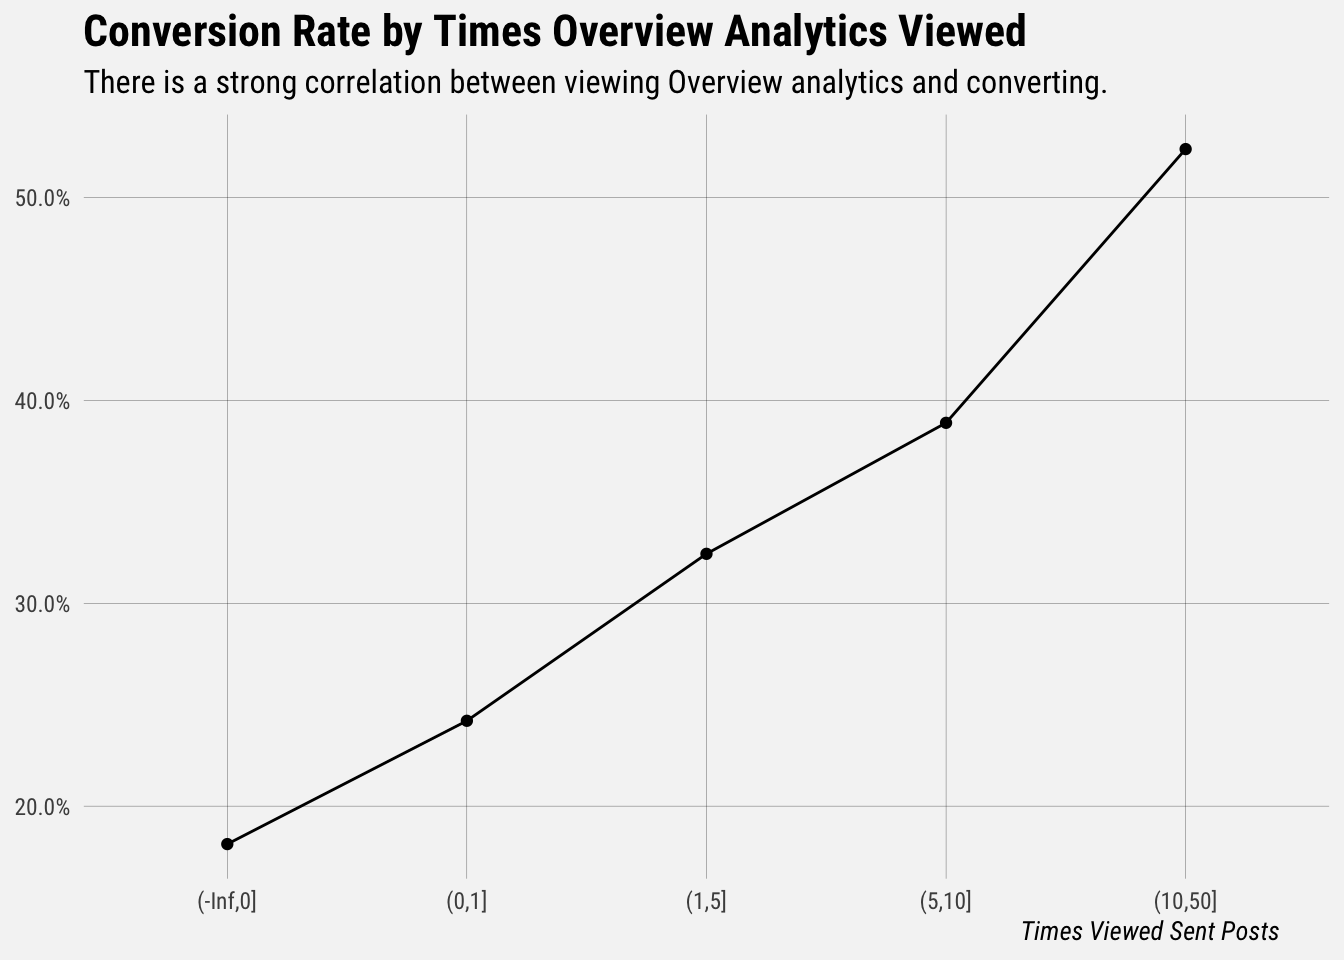
We can see here that most people did not look at the Overview tab in Analytics. Let’s see if there is any correlation between viewing Overview analytics and converting.
Export Analytics CSV
Now let’s see how many Premium trialists export their analytics reports to a CSV.
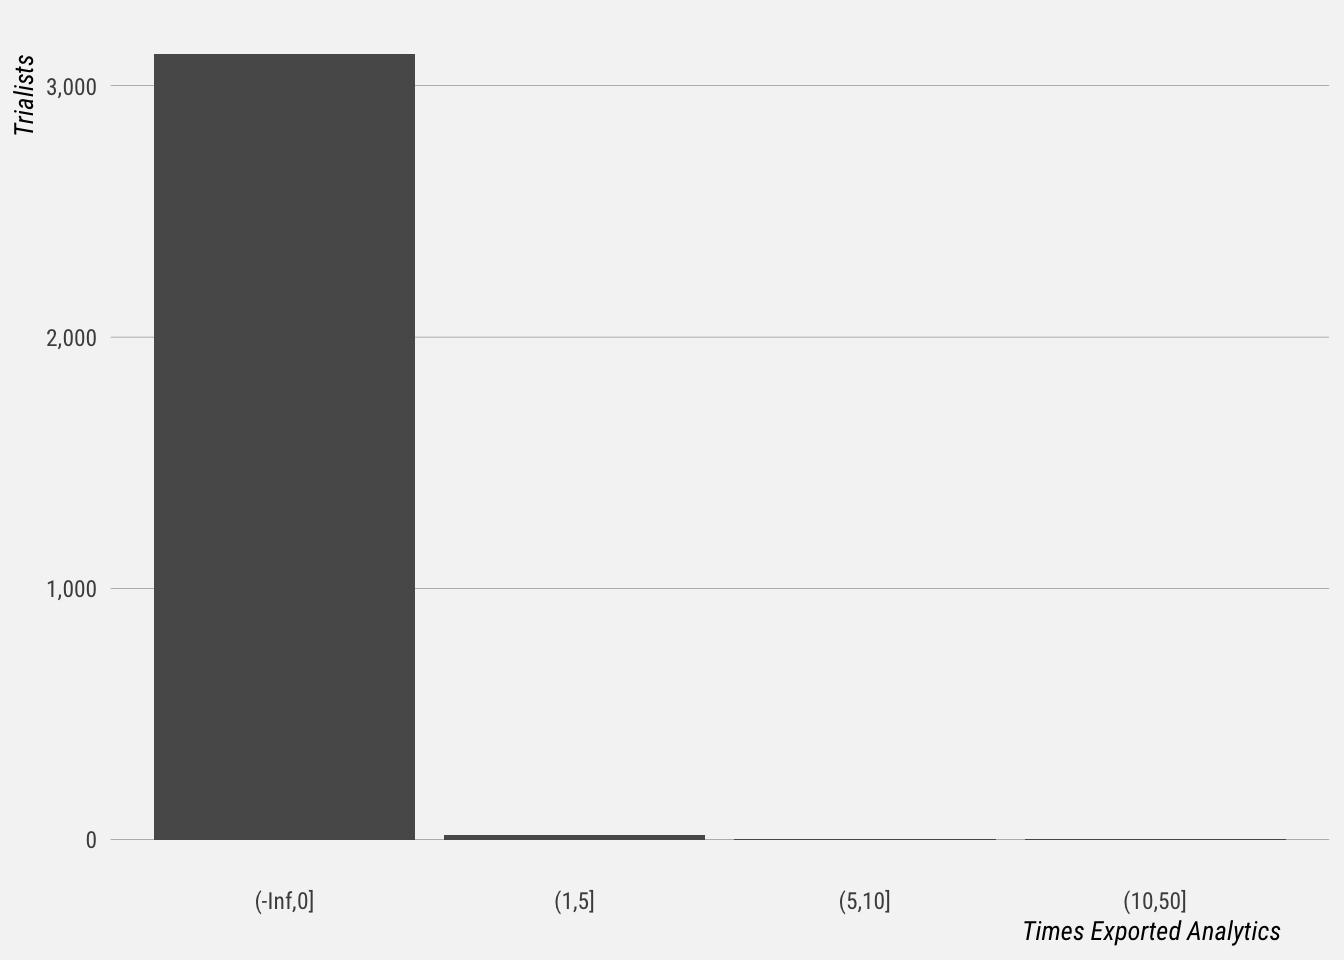
This is a rare event.
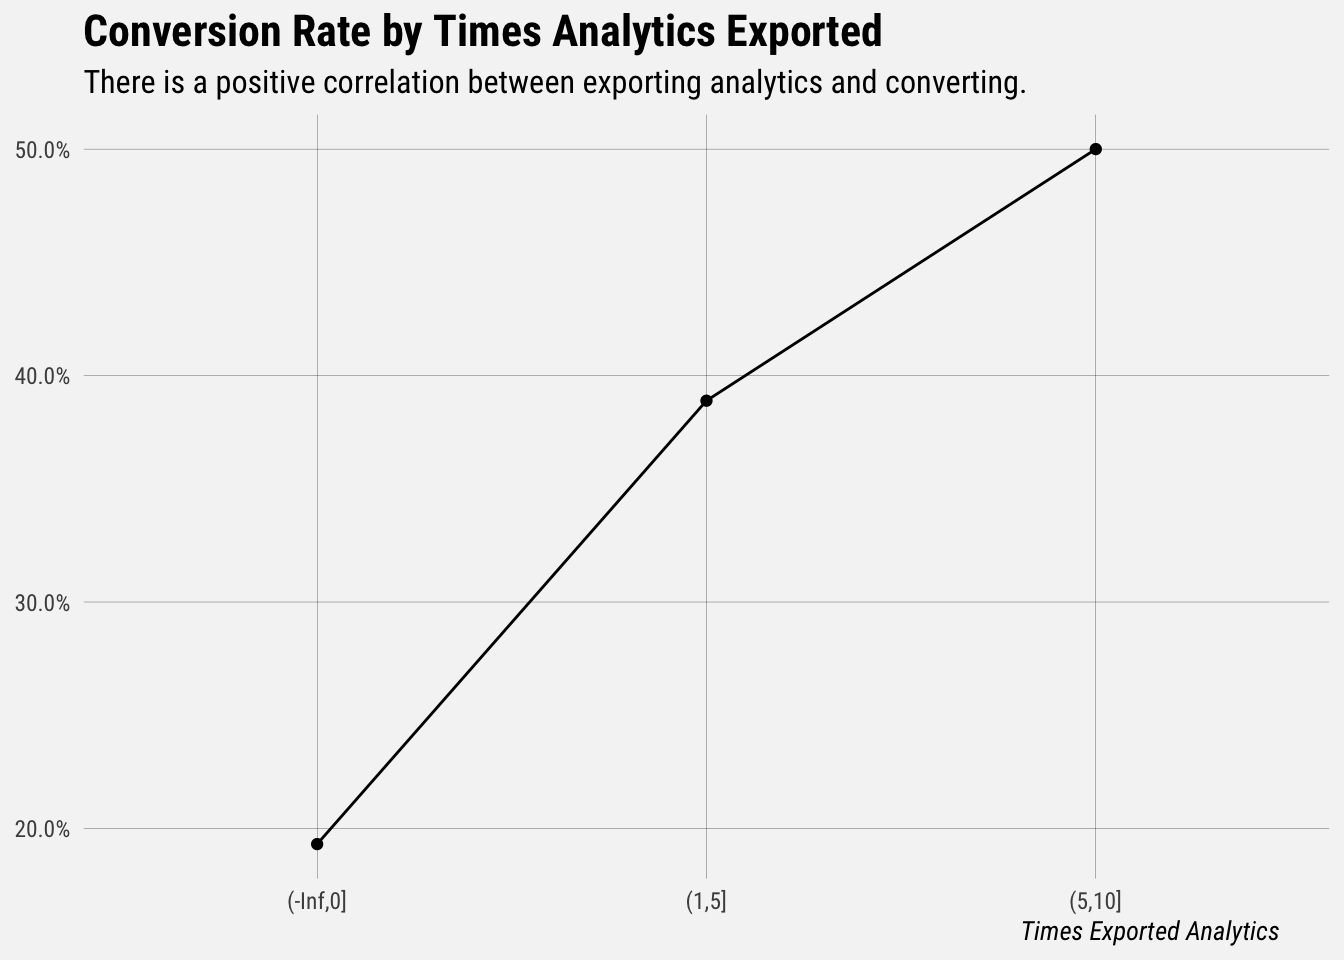
There is a positive correlation between exporting analytics and converting. We should remember that this is correlated with viewing the overview tab.
Calendar Views
Let’s see how many trialists viewed the Week and Month views.
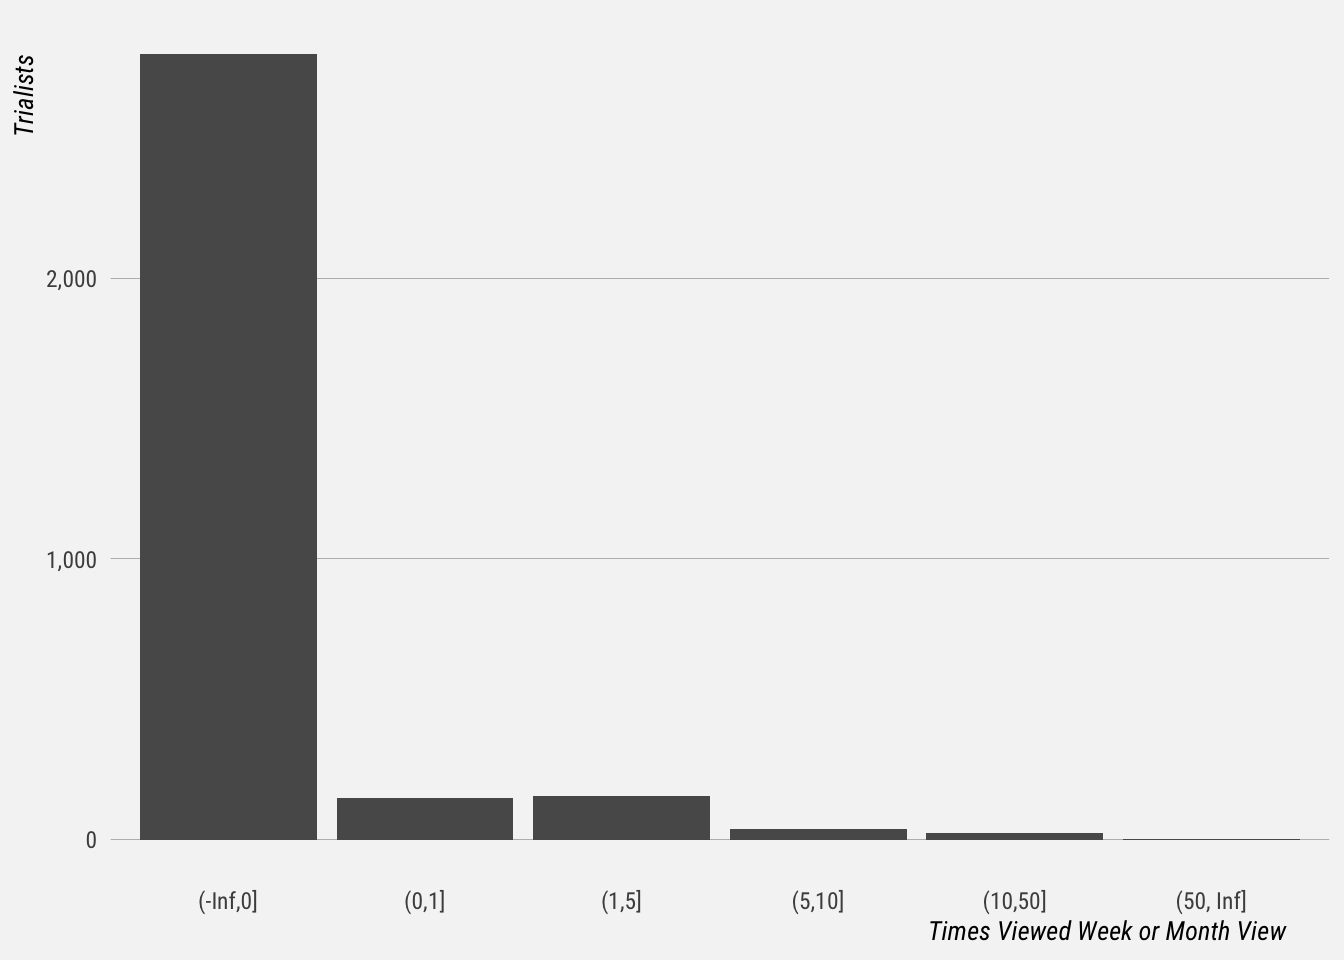
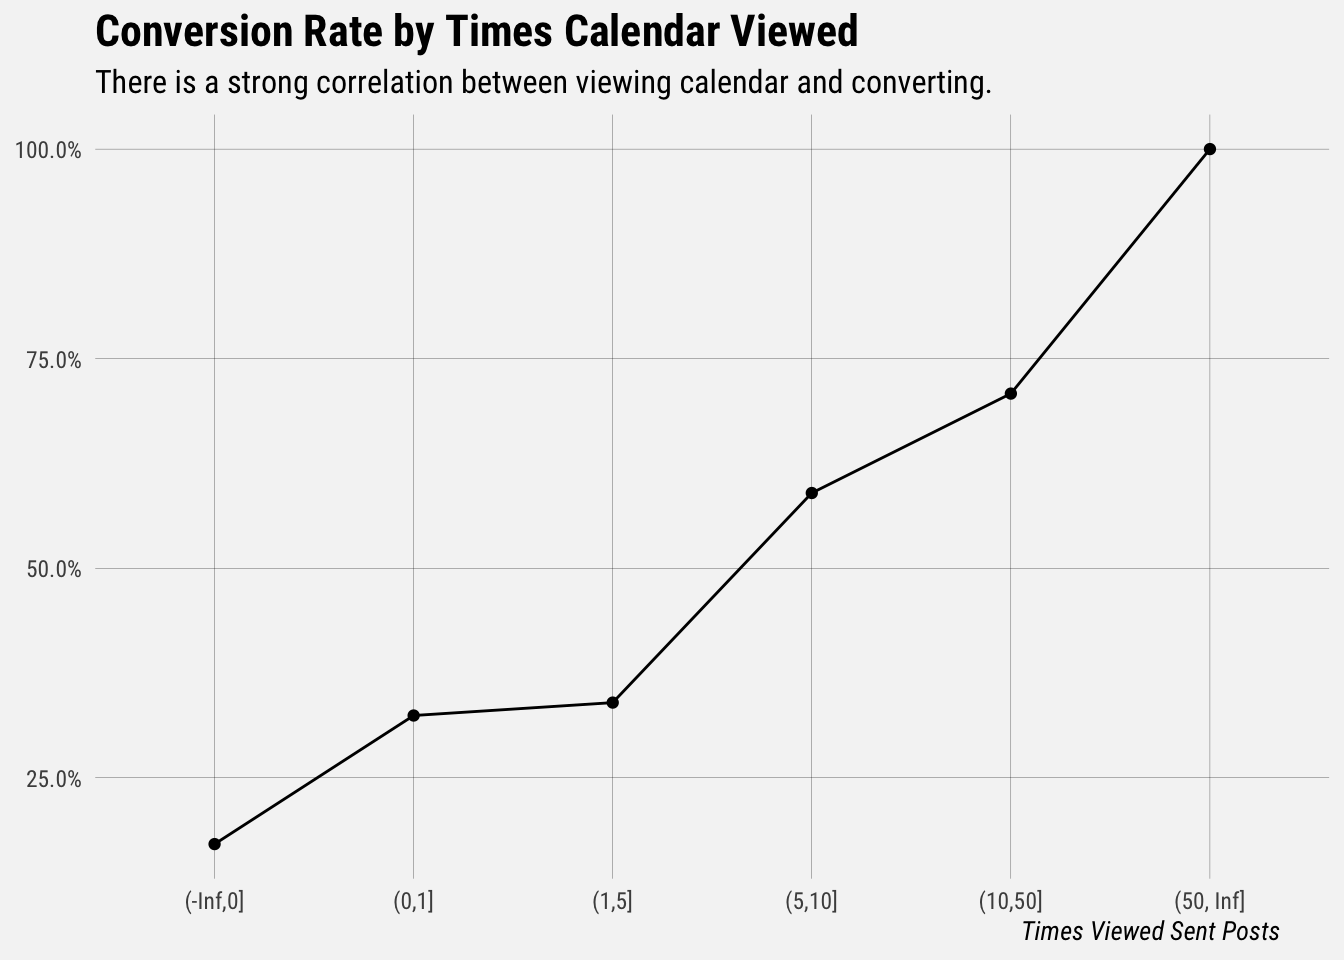
Very few people viewed the week or month views. Let’s see how this correlates with conversion.
Shop Grid
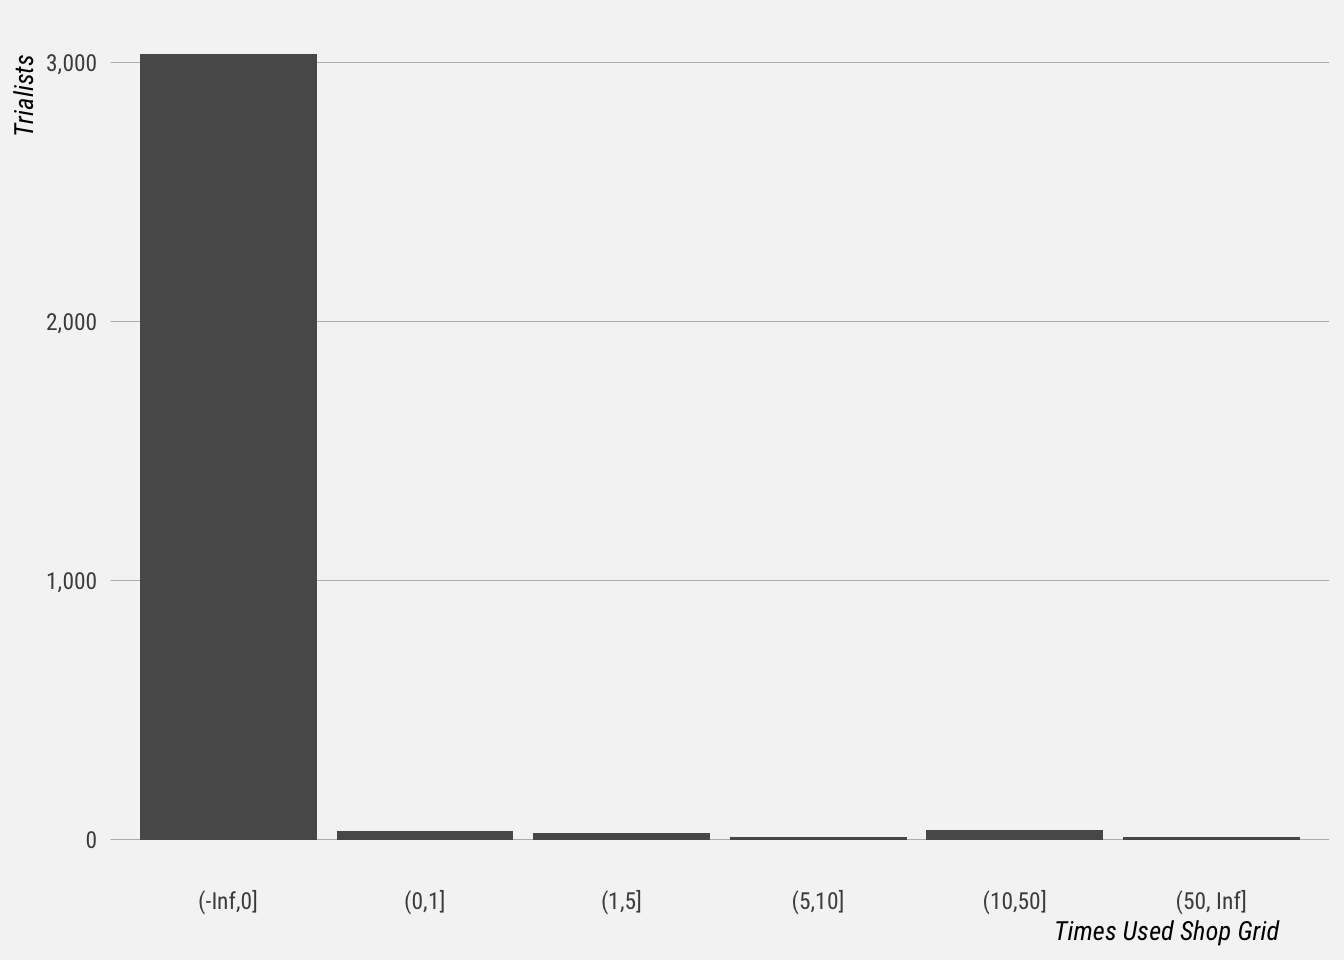
It has been very rare for premium trialists to add a Shop Grid link to a post. Let’s see how it correlates with trial conversion.
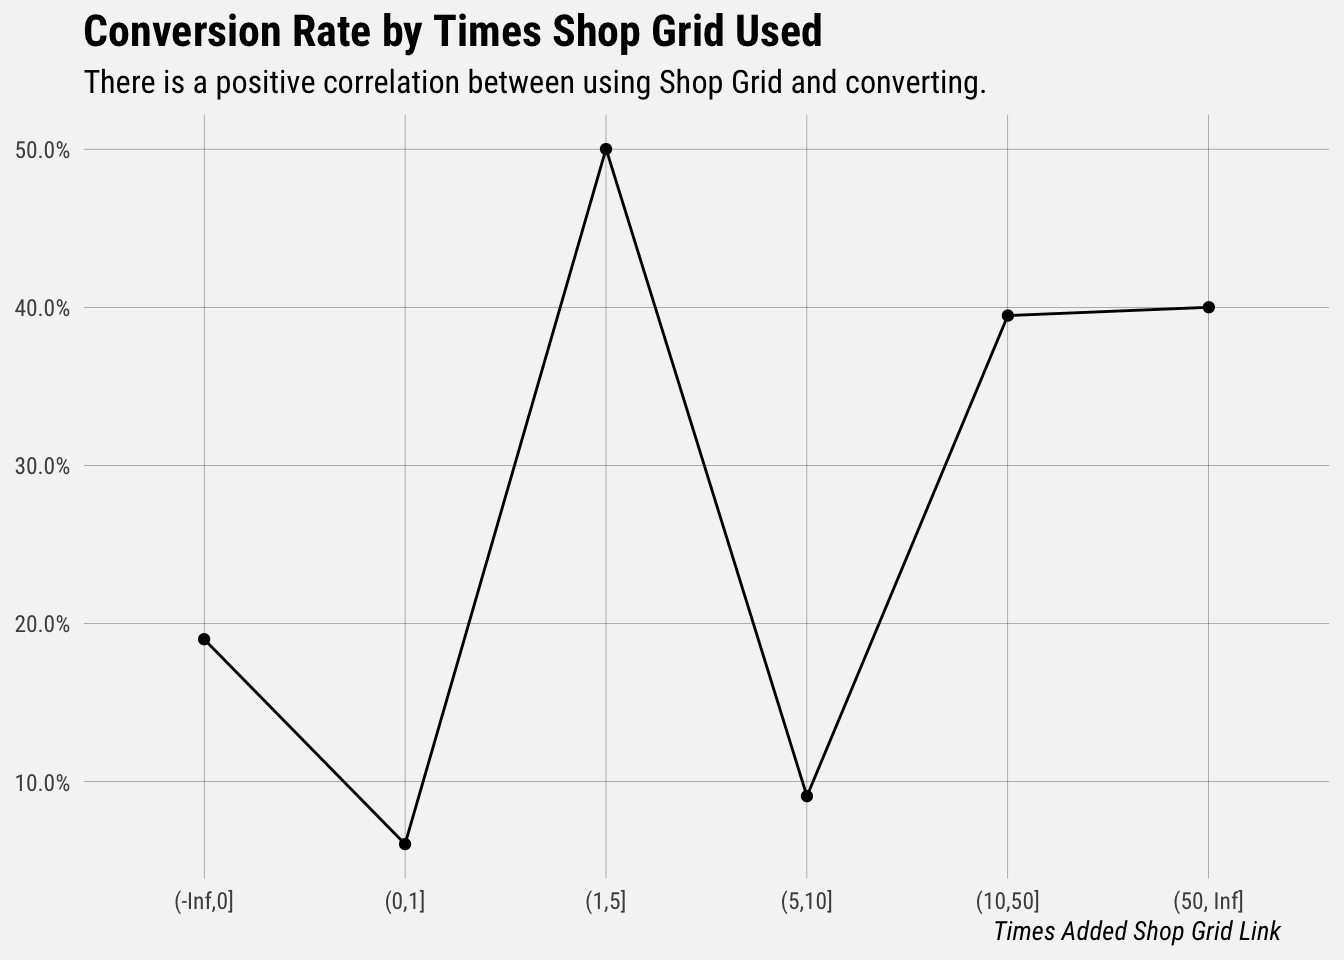
There still seems to be a positive correlation here, but the sample size is small enough for the variance to be large. This means that it’s a little harder to separate the signal from the noise.
Drafts
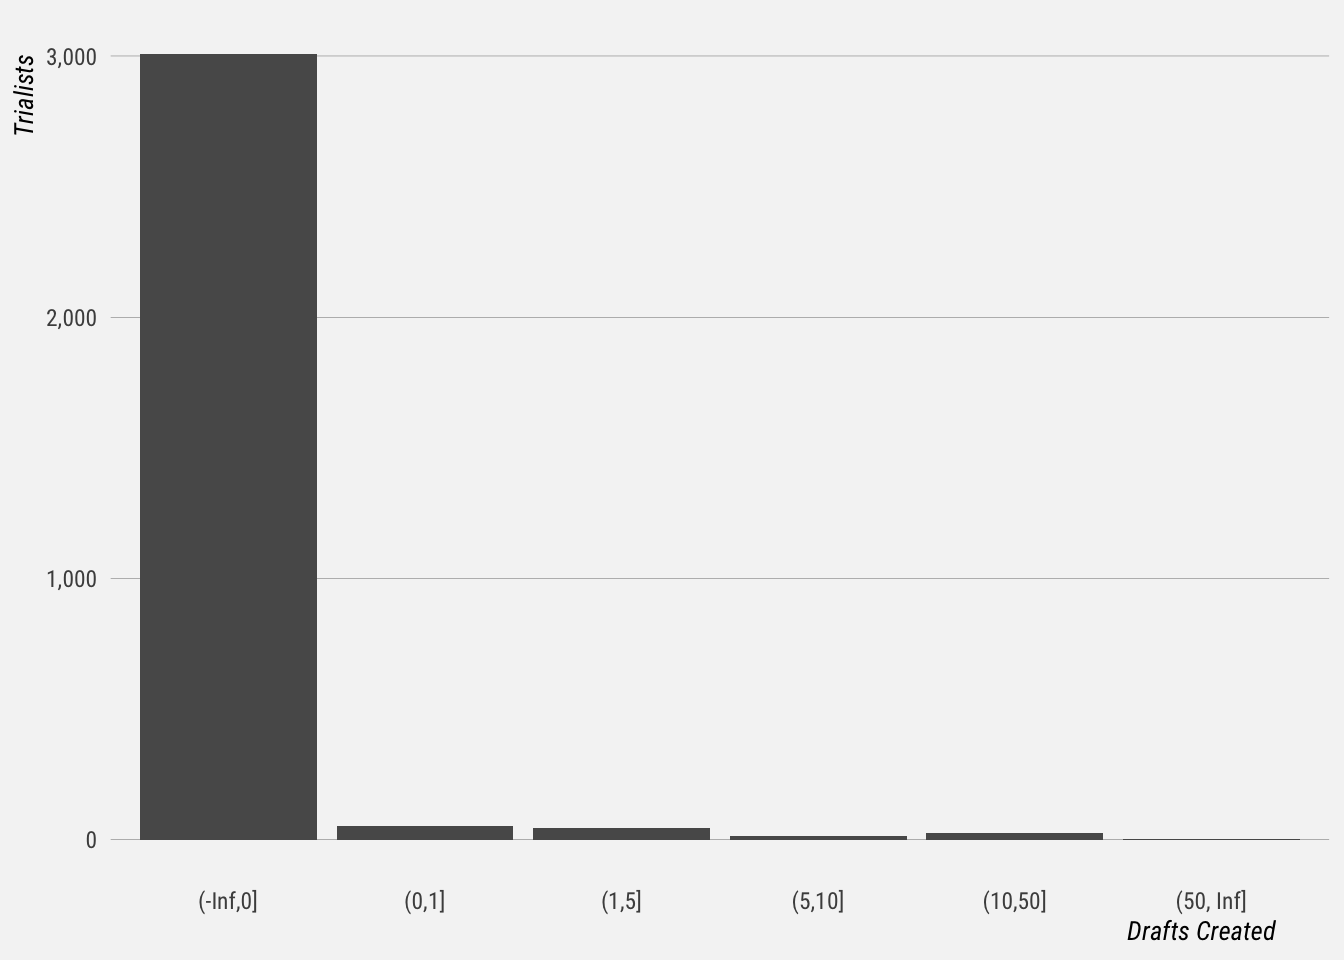
Creating a draft is relatively rare for Premium trialists. Maybe they don’t generally have team members.
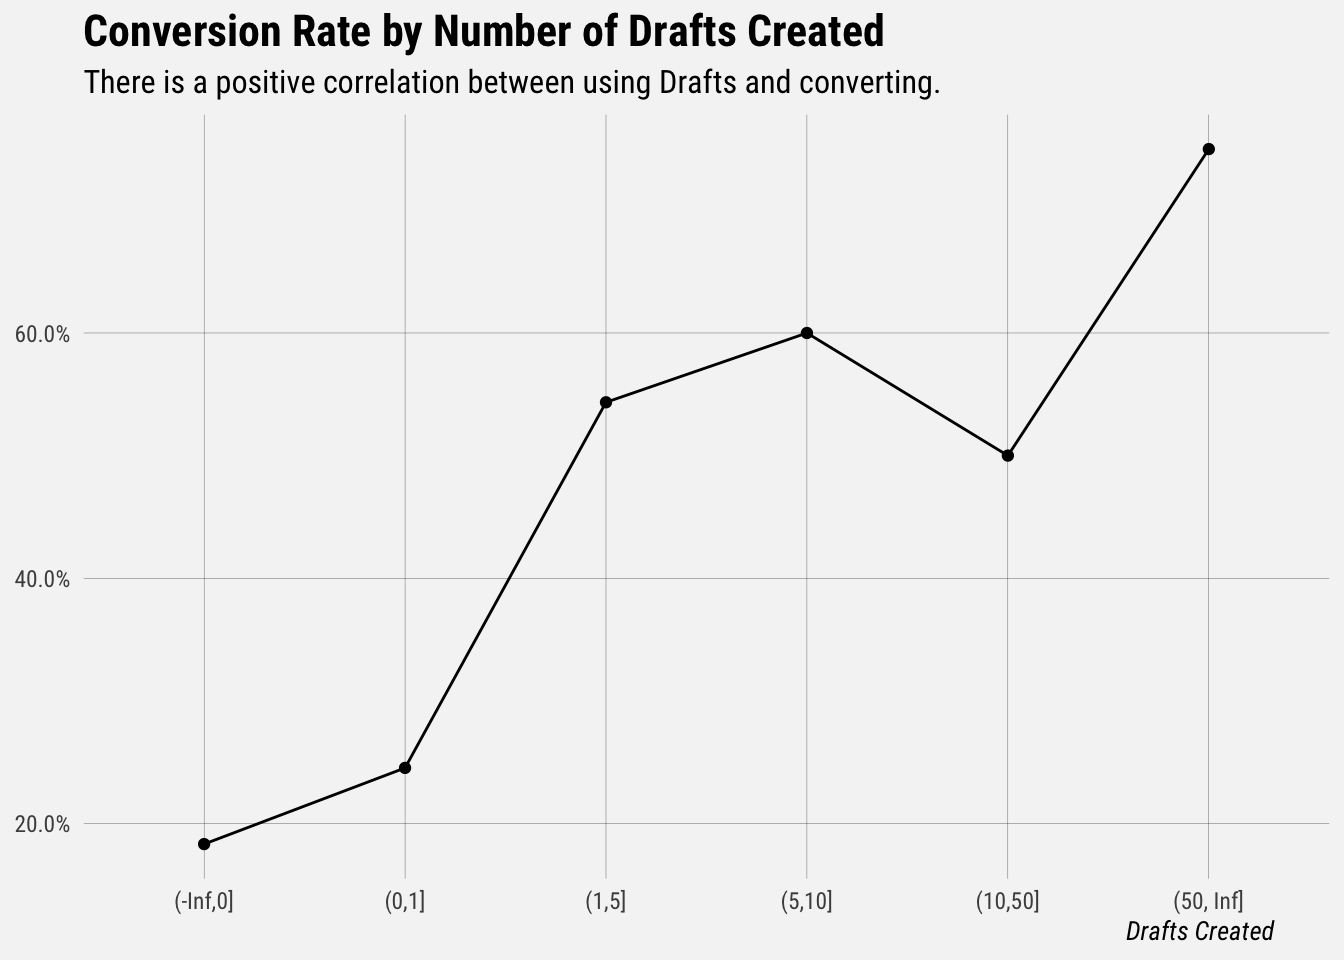
Another positive correlation.