In this analysis we will explore the growth rates of the Instagram profiles of active Analyze users. These profiles all have more than 100k followers as of today.
Data Collection
Tom has exported a file of json files containing the history of follower counts for 536 Instagram profiles. Let’s read them into this R session.
library(jsonlite)
library(janitor)

# read data
profiles <- read_json("~/Downloads/audience/followers.json", simplifyVector = TRUE)

# clean column names
profiles <- clean_names(profiles) %>%
  mutate(date = as.Date(day)) %>%
  rename(current_followers = followed_by_count) %>%
  select(user_id, current_followers)

# set file names
path <- "~/Downloads/audience/data-exports/"
files <- dir(path, pattern = "*.json")

# loop through files and map data
followers <- files %>%
  map_df(~fromJSON(file.path(path, .), flatten = TRUE))

# clean names
followers <- clean_names(followers)

# set date
followers <- followers %>%
  mutate(date = as.Date(day)) %>%
  select(-day) %>%
  inner_join(profiles, by = "user_id")

# save data
saveRDS(followers, "ig_followers_100k.rds")
Let’s briefly skim the data to get a sense of what it looks like.
# skim followed by count
summary(followers$followed_by_count)
## Min. 1st Qu. Median Mean 3rd Qu. Max. NA's
## -365063 107958 172543 386691 339284 7900228 73We see that there are a lot of missing values for username and some missing values for followed_by_count. In addition, there are negative values in followed_by_count we’ll need to address. Let’s look at some of these.
# negative follower counts
followers %>%
  filter(followed_by_count < 0) %>%
  head()
## followed_by_count user_id username date
## 1 -2741 17841400018960244 pacers 2018-11-04
## 2 -269 17841400039956300 lions 2018-11-04
## 3 -365 17841400040295328 pegasusyayinlari 2018-11-04
## 4 -139 17841400040937216 <NA> 2018-11-04
## 5 -700 17841400054473477 markmansonnet 2018-11-04
## 6 -209 17841400060450692 globalstreetart 2018-11-04
## current_followers
## 1 1618214
## 2 203478
## 3 225235
## 4 370798
## 5 228932
## 6 250632Below we fill the missing values with the average of the preceding and following follower counts.
# fill missing values with avg
filled <- followers %>%
  select(-username) %>%
  mutate(followed_by_count = ifelse(followed_by_count <= 0, NA, followed_by_count)) %>%
  group_by(user_id, date) %>%
  summarise(followed_by_count = mean(followed_by_count)) %>%
  mutate(prev_followers = lag(followed_by_count, 1),
         next_followers = lead(followed_by_count, 1),
         avg_followers = (prev_followers + next_followers) / 2,
         followed_by_count = coalesce(followed_by_count, avg_followers)) %>%
  select(-c(prev_followers:avg_followers)) %>%
  filter(!is.na(followed_by_count))
Now I want to assign these profiles into buckets based on the maximum number of followers they have.
# follower buckets
buckets <- c(0, 100000, 200000, 500000, 1000000, Inf)

# assign profiles to buckets
follower_buckets <- filled %>%
  group_by(user_id) %>%
  summarise(max_followers = max(followed_by_count, na.rm = TRUE)) %>%
  mutate(bucket = cut(max_followers, buckets, dig.lab = 10))
Distribution of Follower Counts
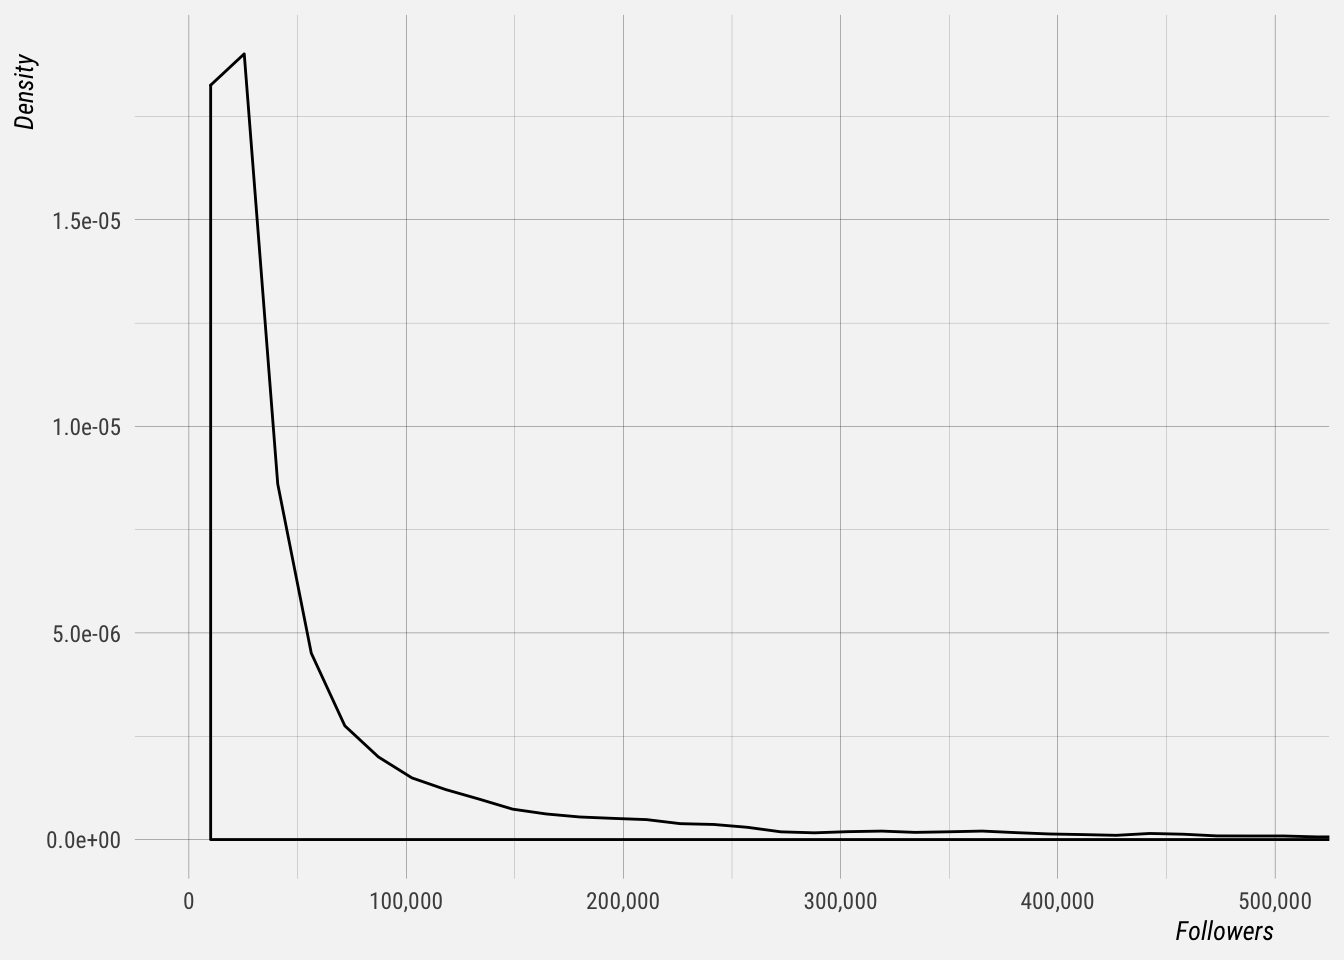
Let’s plot the distribution follower counts for these profiles. We’ll use the maximum follower count for each profile here. We see that there is a long tail of profiles with many followers.
Distribution of Follower Growth
Let’s calculate the rolling 7-day and 30-day growth rates for each profile.
# calculate growth rates
growth_rates <- filled %>%
  group_by(user_id, date) %>%
  summarise(followers = mean(followed_by_count)) %>%
  mutate(followers_last_week = lag(followers, 7),
         followers_last_month = lag(followers, 30),
         weekly_growth_rate = followers / followers_last_week - 1,
         monthly_growth_rate = followers / followers_last_month - 1) %>%
  left_join(follower_buckets, by = "user_id")
Let’s look at the rolling 7-day growth rate of a single profile.
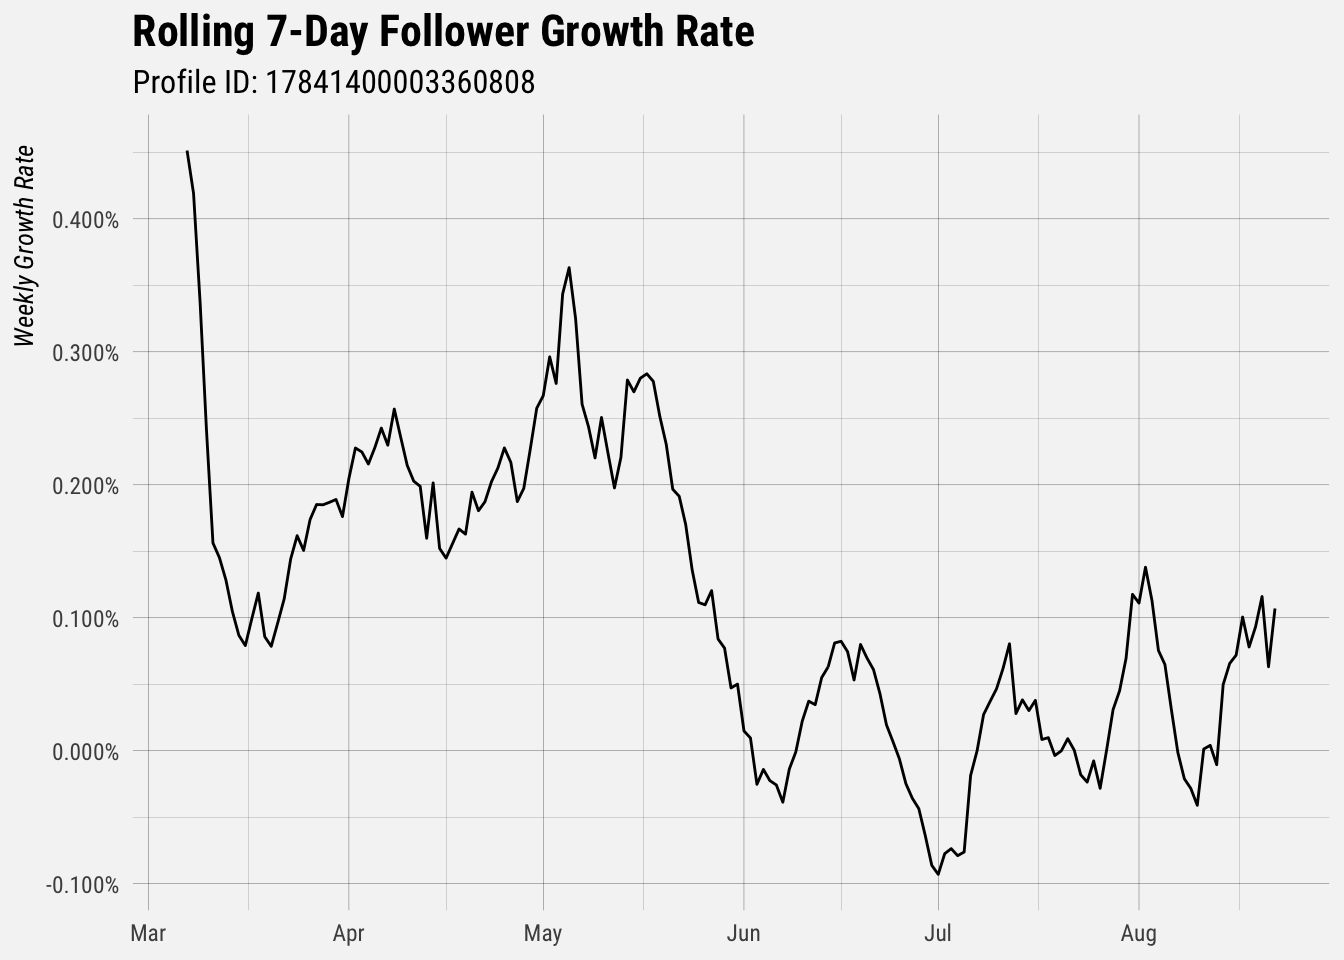
Now, for each profile, we average the 7-day and 30-day growth rates.
# get average growth rates
growth_by_profile <- growth_rates %>%
  group_by(user_id, bucket) %>%
  summarise(n = n(),
            avg_7_day_growth = mean(weekly_growth_rate, na.rm = TRUE),
            avg_30_day_growth = mean(monthly_growth_rate, na.rm = TRUE))
Weekly Growth Rate
Now let’s plot the distribution of the weekly growth rate for each profile.
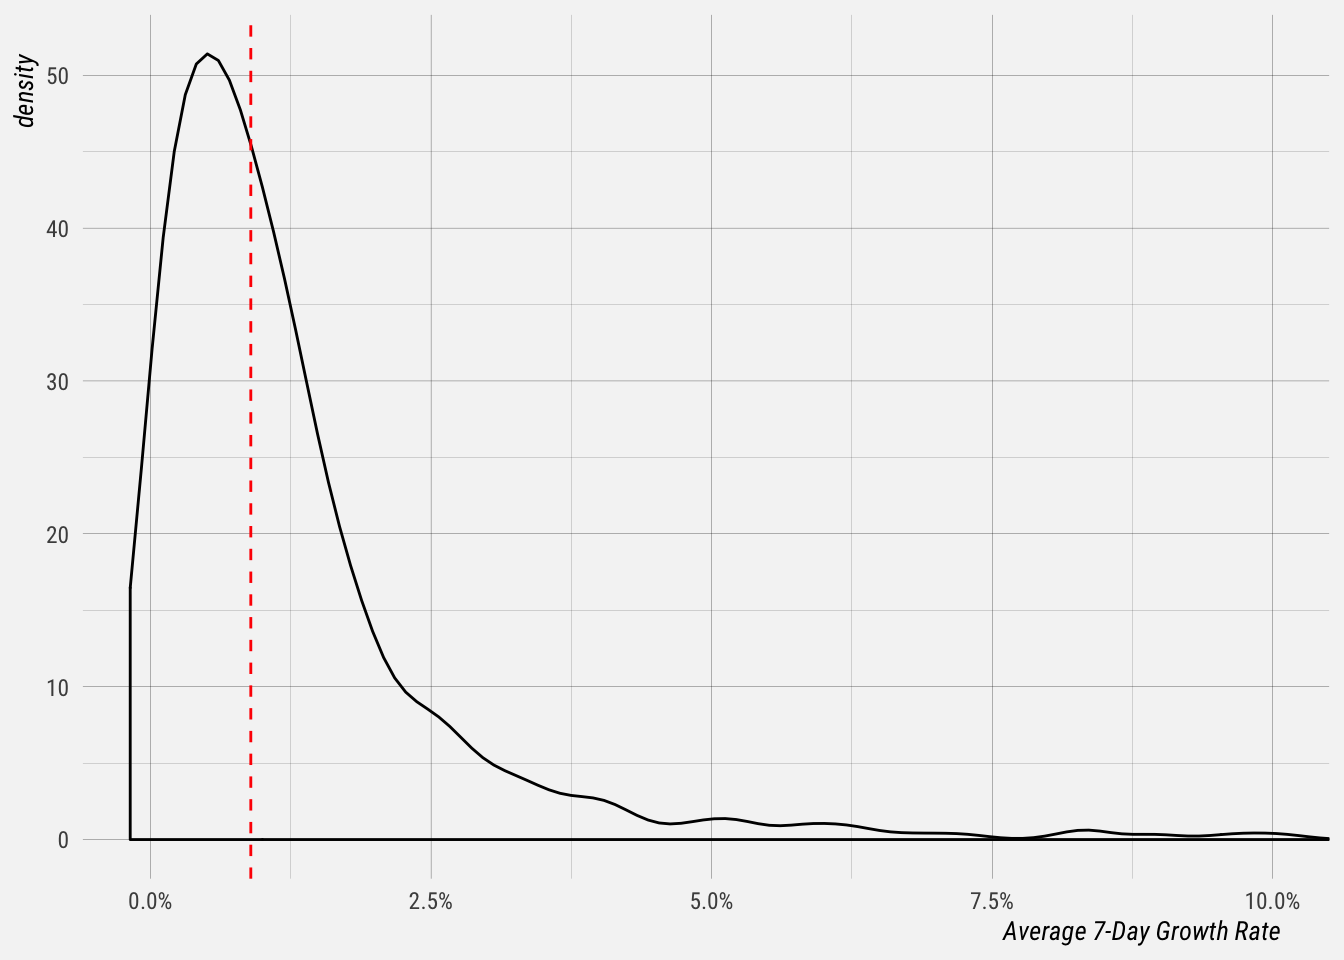
Let’s summarise this distribution to get a better sense of weekly growth.
growth_by_profile %>%
  ungroup() %>%
  filter(!is.na(avg_7_day_growth) & n > 5 & avg_7_day_growth <= 1) %>%
  select(avg_7_day_growth) %>%
  skim()
## Skim summary statistics
## n obs: 534
## n variables: 1
##
## ── Variable type:numeric ────────────────────────────────────────────────────────────────────────────────────────────
## variable missing complete n mean sd p0 p25 p50
## avg_7_day_growth 0 534 534 0.021 0.052 -0.0018 0.0042 0.0089
## p75 p100 hist
## 0.017 0.5 ▇▁▁▁▁▁▁▁The median 7-day growth rate for all of these profiles is 0.89% and the average is 2.1%. Around a quarter of profiles grow at a rate of 0.42% per week or less, and 75% of profiles grow at a rate of 1.7% or less.
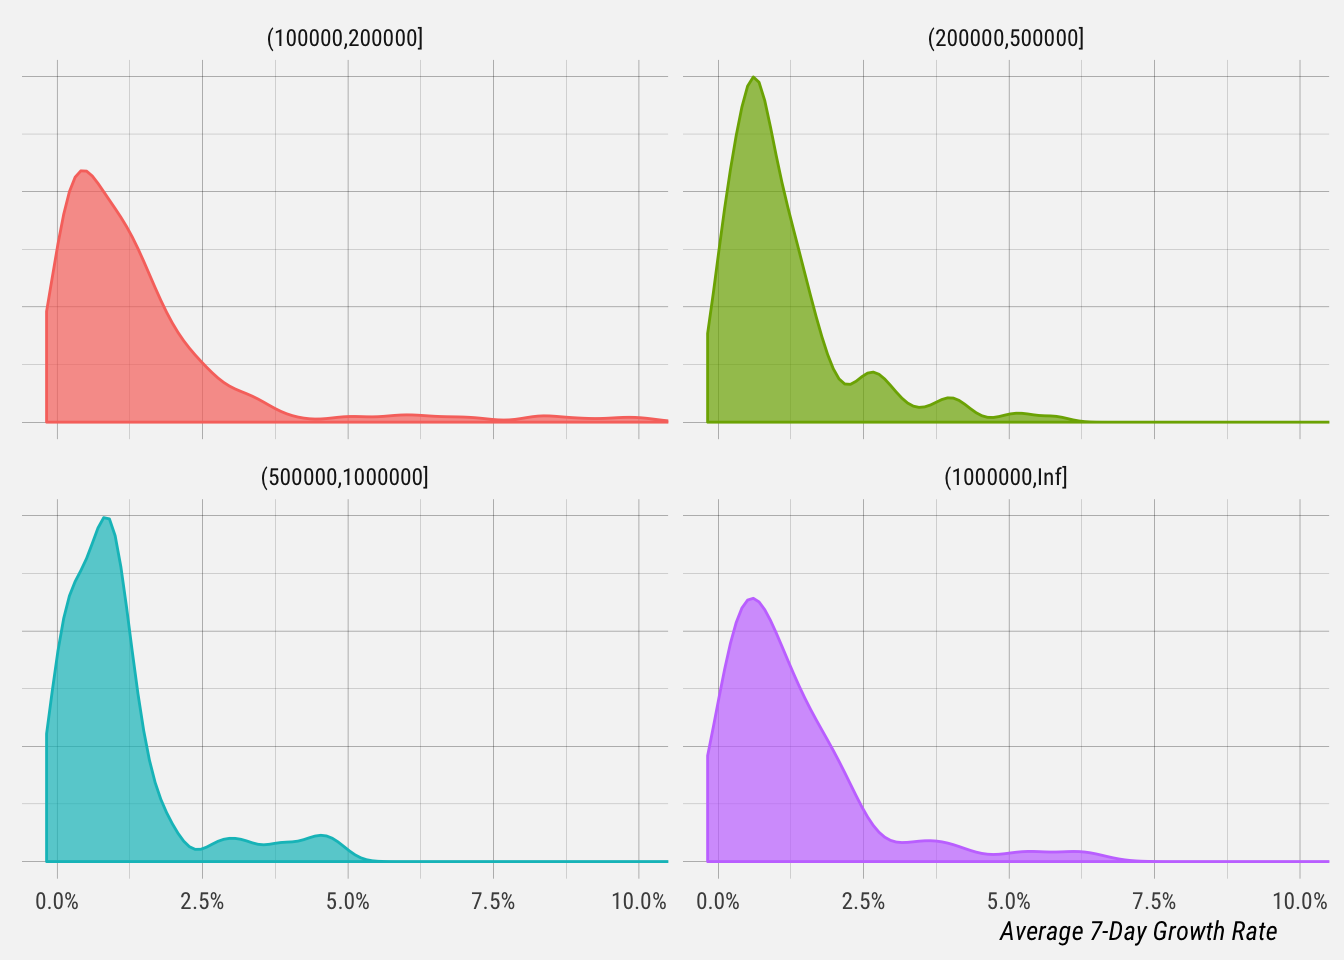
Let’s break this down by bucket.
# summarise distributions
growth_by_profile %>%
  ungroup() %>%
  filter(!is.na(avg_7_day_growth) & n > 5 & avg_7_day_growth <= 1) %>%
  group_by(bucket) %>%
  select(bucket, avg_7_day_growth) %>%
  skim()
## Skim summary statistics
## n obs: 534
## n variables: 2
## group variables: bucket
##
## ── Variable type:numeric ────────────────────────────────────────────────────────────────────────────────────────────
## bucket variable missing complete n mean sd
## (100000,200000] avg_7_day_growth 0 240 240 0.025 0.061
## (200000,500000] avg_7_day_growth 0 181 181 0.019 0.05
## (500000,1000000] avg_7_day_growth 0 53 53 0.014 0.031
## (1000000,Inf] avg_7_day_growth 0 60 60 0.019 0.037
## p0 p25 p50 p75 p100 hist
## -0.0011 0.004 0.01 0.018 0.45 ▇▁▁▁▁▁▁▁
## -0.0018 0.0047 0.0084 0.014 0.5 ▇▁▁▁▁▁▁▁
## -0.0012 0.0031 0.0083 0.012 0.22 ▇▁▁▁▁▁▁▁
## 9.8e-05 0.0041 0.01 0.018 0.24 ▇▁▁▁▁▁▁▁This gives us summary statistics for each profile bucket.
- For profiles with 100-200k followers, the median 7-day growth rate is 1% and the average is 2.5%.
- For profiles with 200-500k followers, the median 7-day growth rate is 0.84% and the average is 1.9%.
- For profiles with 500k-1m followers, the median 7-day growth rate is 0.83% and the average is 1.4%.
- For profiles with over 1m followers, the median 7-day growth rate is 1% and the average is 1.9%.
30-Day Growth Rates
Let’s take the same approach for looking at monthly growth rates.
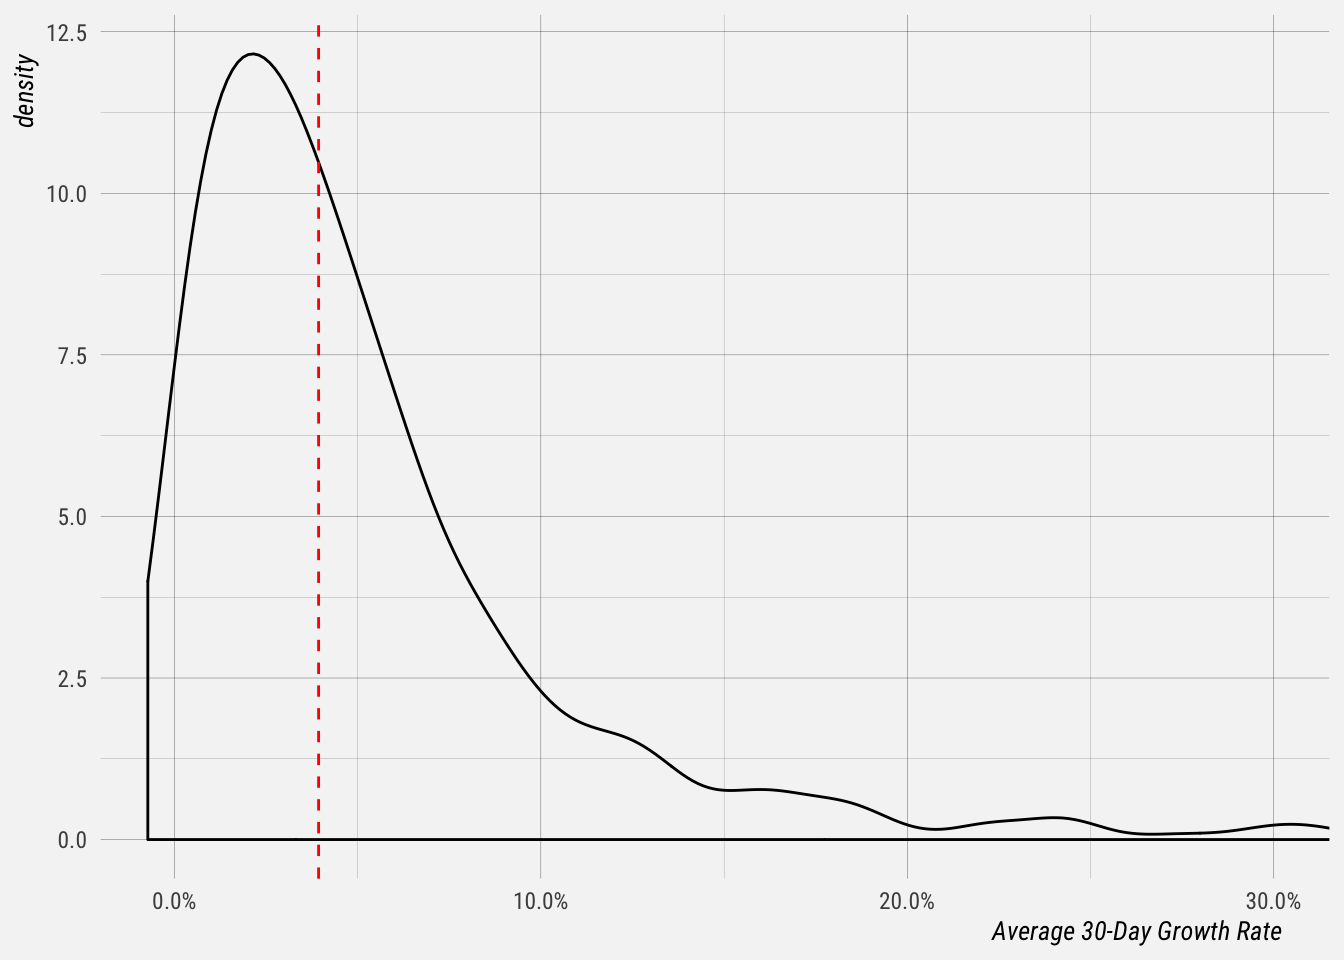
The median 30-day growth rate for these profiles is 3.8%, and the average is 6.1%. Around a quarter of these profiles have an average 30-day growth rate of 1.7% or less, and three quarters have an average 30-day growth rate of 6.9% or less.
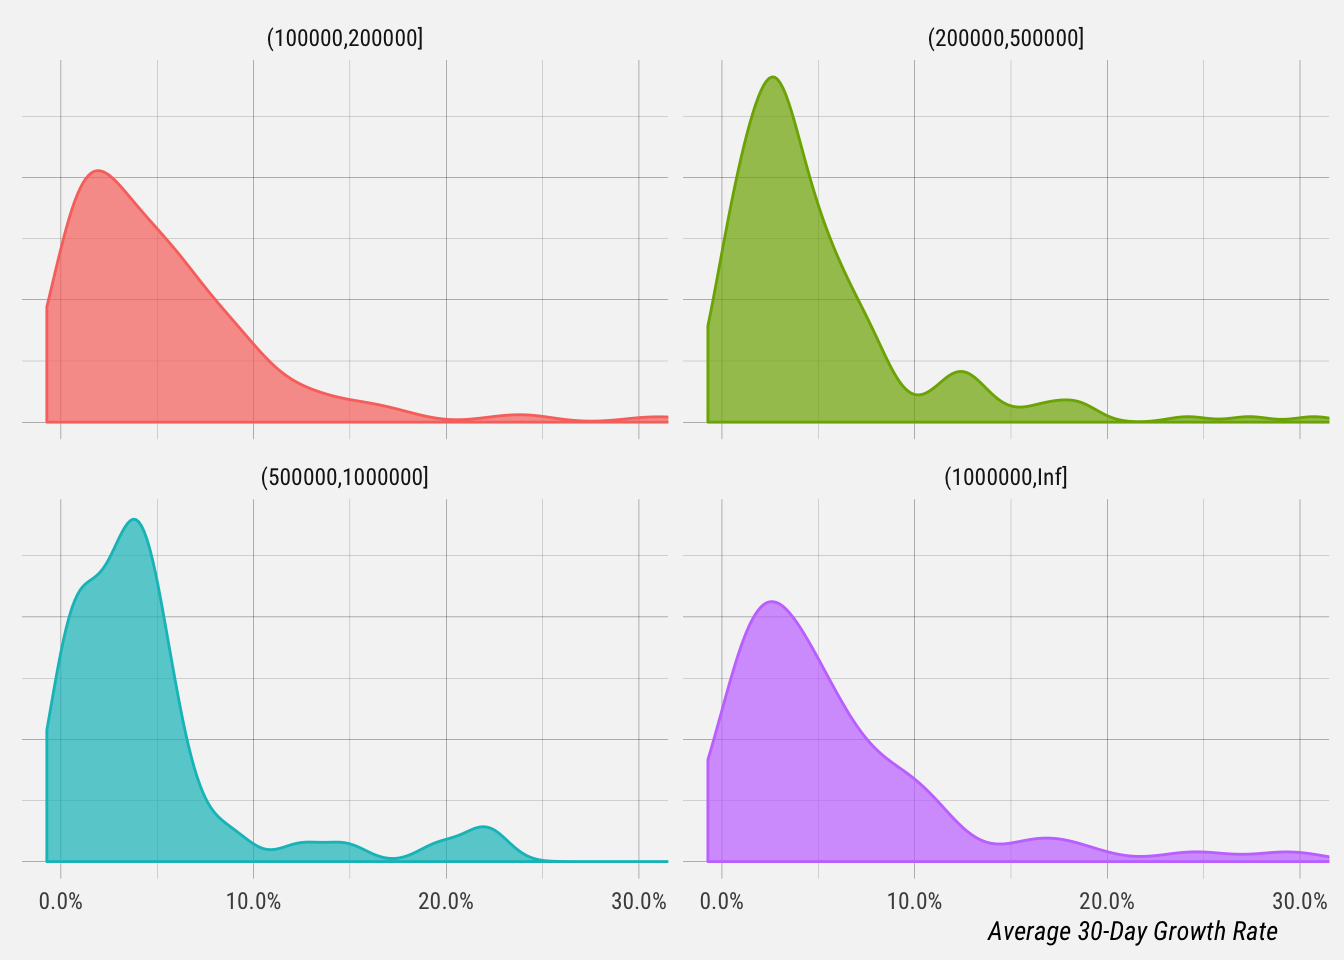
Let’s break this down by follower bucket again.
# summarise distributions
growth_by_profile %>%
  ungroup() %>%
  filter(!is.na(avg_30_day_growth) & n > 5 & avg_30_day_growth <= 1) %>%
  group_by(bucket) %>%
  select(bucket, avg_30_day_growth) %>%
  skim()
## Skim summary statistics
## n obs: 519
## n variables: 2
## group variables: bucket
##
## ── Variable type:numeric ────────────────────────────────────────────────────────────────────────────────────────────
## bucket variable missing complete n mean sd
## (100000,200000] avg_30_day_growth 0 233 233 0.07 0.11
## (200000,500000] avg_30_day_growth 0 176 176 0.05 0.051
## (500000,1000000] avg_30_day_growth 0 52 52 0.046 0.051
## (1000000,Inf] avg_30_day_growth 0 58 58 0.068 0.094
## p0 p25 p50 p75 p100 hist
## -0.0045 0.016 0.042 0.079 0.73 ▇▂▁▁▁▁▁▁
## -0.0073 0.019 0.034 0.062 0.31 ▇▆▁▁▁▁▁▁
## -0.0052 0.013 0.036 0.049 0.22 ▇▇▂▁▁▁▁▁
## 8e-04 0.019 0.044 0.079 0.63 ▇▂▁▁▁▁▁▁This gives us summary statistics for each profile bucket.
- For profiles with 100-200k followers, the median 30-day growth rate is 4.2% and the average is 7%.
- For profiles with 200-500k followers, the median 30-day growth rate is 3.4% and the average is 5%.
- For profiles with 500k-1m followers, the median 30-day growth rate is 3.6% and the average is 4.6%.
- For profiles with over 1m followers, the median 30-day growth rate is 4.4% and the average is 6.8%.