In this analysis we will explore the growth rates of the total audiences of active Analyze users’ profiles.
Data Collection
Tom has exported a file of json files containing the history of follower counts for 536 Instagram profiles. Let’s read them into this R session.
library(jsonlite)
library(purrr)

# get filenames
filenames <- list.files("~/Downloads/analyze/users/", pattern = "*.json", full.names = TRUE)

# create empty data frame
users <- data.frame(day = character(),
                    followers = numeric(),
                    numberOfProfiles = numeric(),
                    user = character(),
                    stringsAsFactors = FALSE)

# loop through files
for (name in filenames) {

  user <- read_json(name, simplifyVector = TRUE) %>%
    mutate(user = gsub("/Users/julianwinternheimer/Downloads/analyze/users//", "", name),
         user = gsub(".json", "", user))

  users <- rbind(users, user)

}

# set column names
names(users) <- c("date", "followers", "profiles", "user_id")

# set date
users$date <- as.Date(users$date)

# save data
saveRDS(users, "analyze_user_followers.rds")
Now let’s summarise the data to get a sense of what it looks like.
# skim followed by count
summary(users$followers)
## Min. 1st Qu. Median Mean 3rd Qu. Max.
## -88135 875 5368 67337 27031 25501687There are some missing values and negative values. Let’s remove these and replace them with the average of the preceding and following follower count for each user.
# fill missing values with avg
filled <- users %>%
  mutate(followers = ifelse(followers <= 0, NA, followers)) %>%
  group_by(user_id, date) %>%
  summarise(followers = mean(followers, na.rm = TRUE)) %>%
  mutate(prev_followers = lag(followers, 1),
         next_followers = lead(followers, 1),
         avg_followers = (prev_followers + next_followers) / 2,
         followers = coalesce(followers, avg_followers)) %>%
  select(-c(prev_followers:avg_followers)) %>%
  filter(!is.na(followers))
## `summarise()` regrouping output by 'user_id' (override with `.groups` argument)Now let’s summarise the follower counts again.
# skim followed by count
summary(filled$followers)
## Min. 1st Qu. Median Mean 3rd Qu. Max.
## 1 1343 6787 72772 30587 25501687That looks much better. Now we want to assign these users into buckets based on the maximum number of followers they have.
# follower buckets
buckets <- c(0, 10000, 100000, 200000, 500000, 1000000, Inf)

# assign profiles to buckets
follower_buckets <- filled %>%
  group_by(user_id) %>%
  summarise(max_followers = max(followers, na.rm = TRUE)) %>%
  mutate(bucket = cut(max_followers, buckets, dig.lab = 10))
## `summarise()` ungrouping output (override with `.groups` argument)Distribution of Follower Counts
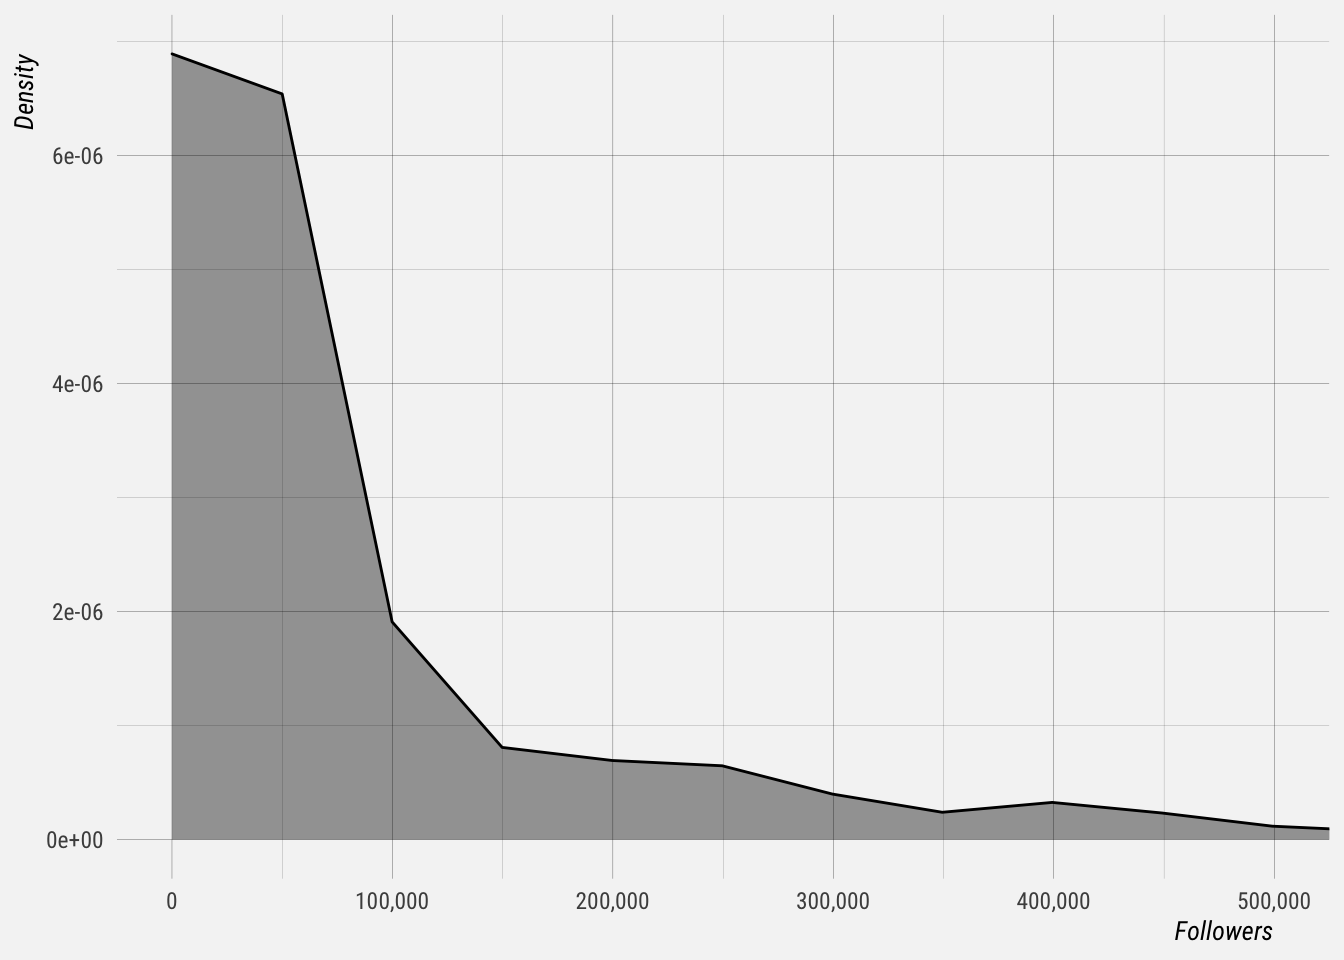
Let’s plot the distribution follower counts for these users We’ll use the maximum follower count for each user here. We see that there is a long tail of user with many followers.
Distribution of Follower Growth
Let’s calculate the rolling 7-day and 30-day growth rates for each user
# calculate growth rates
growth_rates <- filled %>%
  group_by(user_id, ,date) %>%
  summarise(followers = mean(followers)) %>%
  mutate(followers_last_week = lag(followers, 7),
         followers_last_month = lag(followers, 30),
         weekly_growth_rate = followers / followers_last_week - 1,
         monthly_growth_rate = followers / followers_last_month - 1) %>%
  left_join(follower_buckets, by = "user_id")
## `summarise()` regrouping output by 'user_id' (override with `.groups` argument)Let’s look at the rolling 7-day growth rate of a single user
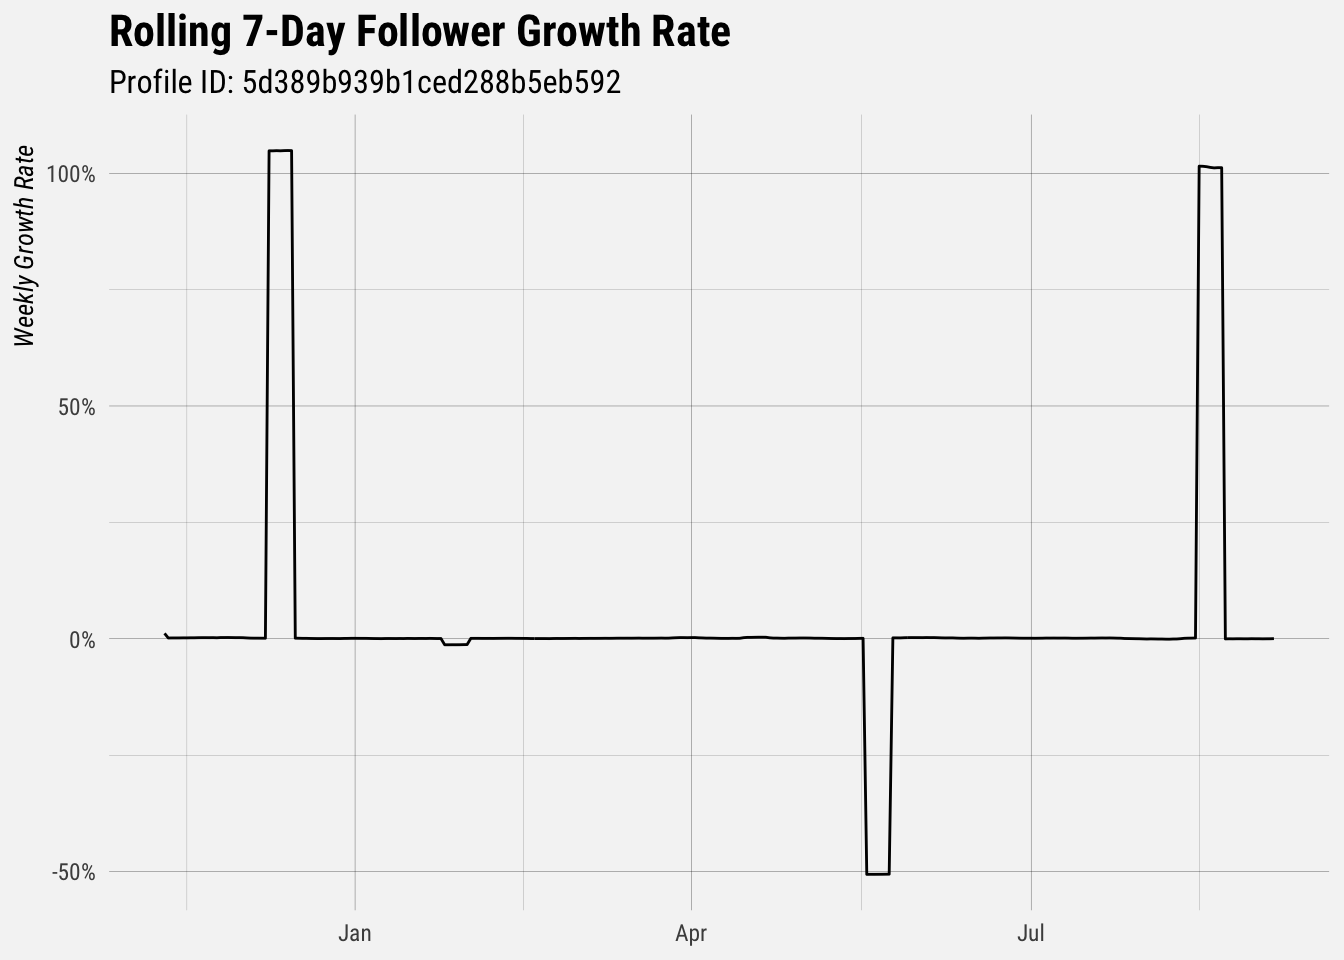
The big changes in the growth rate of followers for this user came when they added and removed profiles to the anlayze account. This will be true for all users that add and remove profiles.
Because of these extreme jumps in the growth rates, we will take the median 7-day and 30-day growth rates for each user.
# get median growth rates
growth_by_user <- growth_rates %>%
  group_by(user_id, bucket) %>%
  summarise(users = n_distinct(user_id),
            med_7_day_growth = median(weekly_growth_rate, na.rm = TRUE),
            med_30_day_growth = median(monthly_growth_rate, na.rm = TRUE))
## `summarise()` regrouping output by 'user_id' (override with `.groups` argument)Weekly Growth Rate
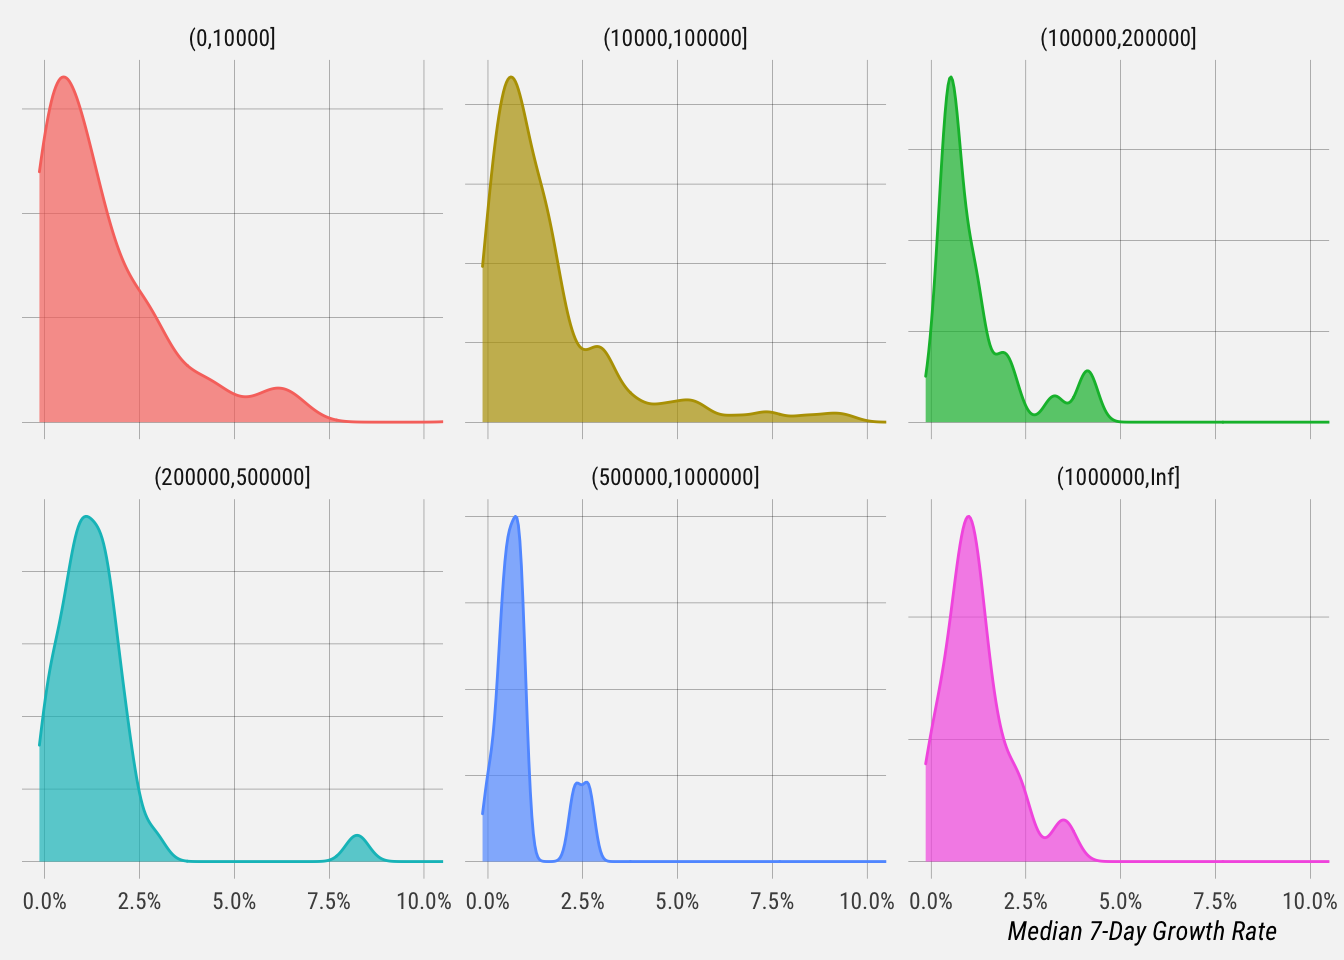
Let’s plot the distribution of weekly growth rates for each follower bucket.
# summarise distributions
growth_by_user %>%
  ungroup() %>%
  filter(!is.na(med_7_day_growth) & med_7_day_growth <= 1) %>%
  group_by(bucket) %>%
  select(bucket, med_7_day_growth) %>%
skim()| Name | Piped data |
| Number of rows | 372 |
| Number of columns | 2 |
| _______________________ | |
| Column type frequency: | |
| numeric | 1 |
| ________________________ | |
| Group variables | bucket |
Variable type: numeric
| skim_variable | bucket | n_missing | complete_rate | mean | sd | p0 | p25 | p50 | p75 | p100 | hist |
|---|---|---|---|---|---|---|---|---|---|---|---|
| med_7_day_growth | (0,10000] | 0 | 1 | 0.02 | 0.03 | 0 | 0.00 | 0.01 | 0.02 | 0.20 | ▇▁▁▁▁ |
| med_7_day_growth | (10000,100000] | 0 | 1 | 0.02 | 0.02 | 0 | 0.00 | 0.01 | 0.02 | 0.09 | ▇▂▁▁▁ |
| med_7_day_growth | (100000,200000] | 0 | 1 | 0.01 | 0.01 | 0 | 0.00 | 0.01 | 0.01 | 0.04 | ▇▂▂▁▁ |
| med_7_day_growth | (200000,500000] | 0 | 1 | 0.01 | 0.01 | 0 | 0.01 | 0.01 | 0.02 | 0.08 | ▇▂▁▁▁ |
| med_7_day_growth | (500000,1000000] | 0 | 1 | 0.01 | 0.01 | 0 | 0.00 | 0.01 | 0.01 | 0.03 | ▅▇▁▁▂ |
| med_7_day_growth | (1000000,Inf] | 0 | 1 | 0.01 | 0.01 | 0 | 0.01 | 0.01 | 0.02 | 0.03 | ▇▇▂▂▁ |
This gives us summary statistics for each profile bucket.
- For the 114 users with 0-10k followers, the median 7-day growth rate is 1% and the average is 1.8%.
- For the 166 users with 10-100k followers, the median 7-day growth rate is 1% and the average is 1.6%.
- For the 26 users with 100k-200k followers, the median 7-day growth rate is 0.65% and the average is 1.2%.
- For the 36 users with 200k-500k followers, the median 7-day growth rate is 1.2% and the average is 1.3%.
- For the 12 users with 500k-1m followers, the median 7-day growth rate is 0.87% and the average is 0.89%.
- For the 18 users with over 1m followers, the median 7-day growth rate is 1.5% and the average is 1.2%.
Monthly Growth Rates
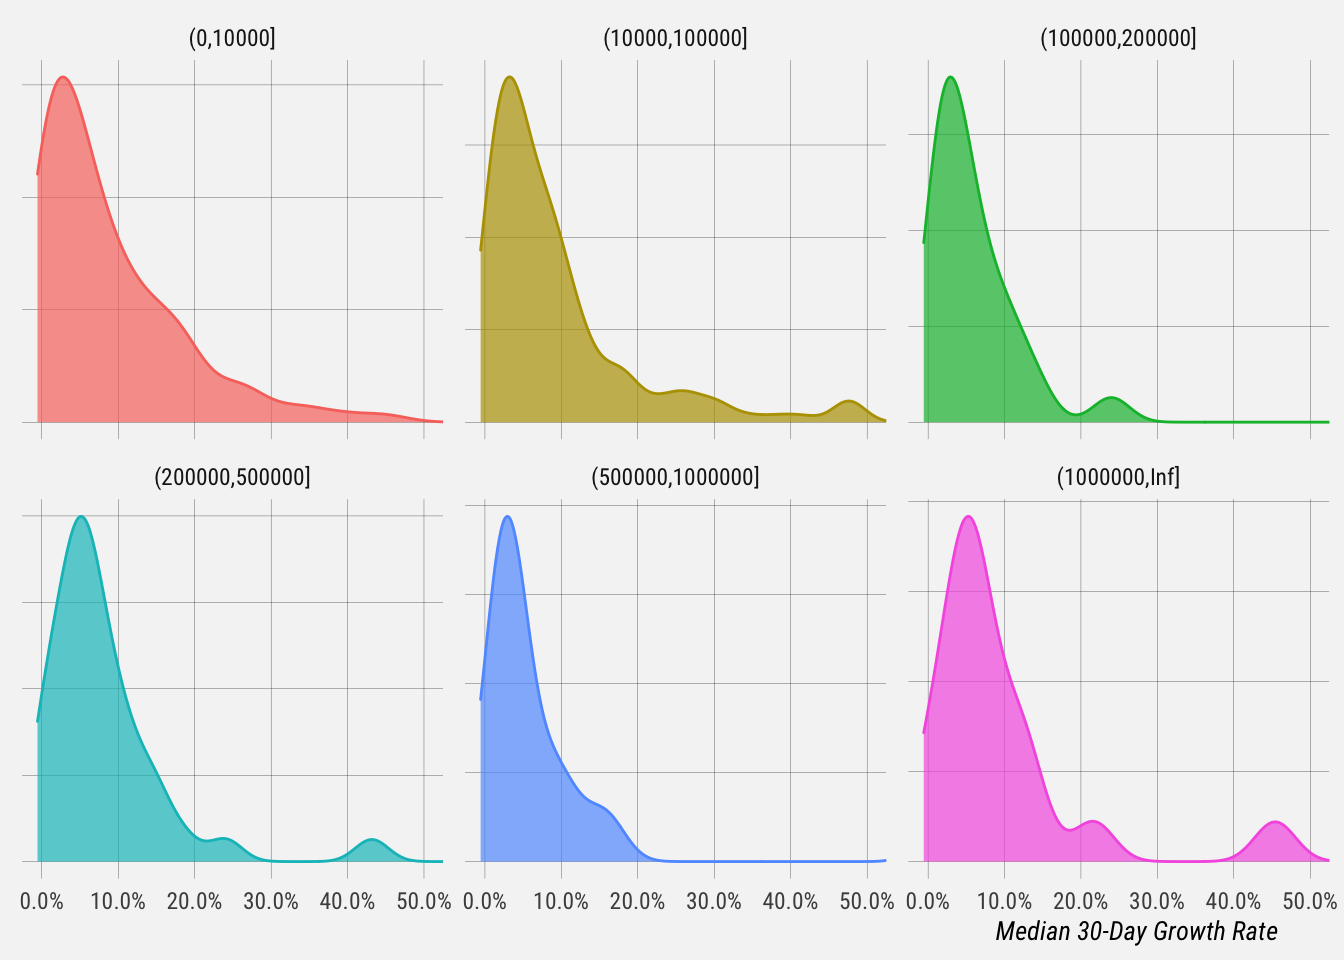
Let’s plot the distribution of monthly growth rates for each follower bucket.
# summarise distributions
growth_by_user %>%
  ungroup() %>%
  filter(!is.na(med_30_day_growth) & med_30_day_growth <= 1) %>%
  group_by(bucket) %>%
  select(bucket, med_30_day_growth) %>%
skim()| Name | Piped data |
| Number of rows | 367 |
| Number of columns | 2 |
| _______________________ | |
| Column type frequency: | |
| numeric | 1 |
| ________________________ | |
| Group variables | bucket |
Variable type: numeric
| skim_variable | bucket | n_missing | complete_rate | mean | sd | p0 | p25 | p50 | p75 | p100 | hist |
|---|---|---|---|---|---|---|---|---|---|---|---|
| med_30_day_growth | (0,10000] | 0 | 1 | 0.09 | 0.11 | 0.00 | 0.02 | 0.06 | 0.13 | 0.78 | ▇▂▁▁▁ |
| med_30_day_growth | (10000,100000] | 0 | 1 | 0.10 | 0.12 | -0.01 | 0.03 | 0.06 | 0.11 | 0.94 | ▇▁▁▁▁ |
| med_30_day_growth | (100000,200000] | 0 | 1 | 0.08 | 0.13 | 0.00 | 0.02 | 0.04 | 0.09 | 0.65 | ▇▁▁▁▁ |
| med_30_day_growth | (200000,500000] | 0 | 1 | 0.08 | 0.08 | 0.00 | 0.04 | 0.06 | 0.10 | 0.43 | ▇▂▁▁▁ |
| med_30_day_growth | (500000,1000000] | 0 | 1 | 0.10 | 0.16 | 0.01 | 0.03 | 0.04 | 0.09 | 0.59 | ▇▁▁▁▁ |
| med_30_day_growth | (1000000,Inf] | 0 | 1 | 0.09 | 0.11 | 0.00 | 0.04 | 0.06 | 0.11 | 0.45 | ▇▃▁▁▁ |
Here are summary statistics for each profile bucket.
- For the 114 users with 0-10k followers, the median 30-day growth rate is 5.5% and the average is 9.3%.
- For the 166 users with 10-100k followers, the median 30-day growth rate is 6.1% and the average is 9.7%.
- For the 26 users with 100k-200k followers, the median 30-day growth rate is 4.5% and the average is 8%.
- For the 36 users with 200k-500k followers, the median 30-day growth rate is 6% and the average is 8.1%.
- For the 12 users with 500k-1m followers, the median 30-day growth rate is 3.6% and the average is 9.7%.
- For the 18 users with over 1m followers, the median 30-day growth rate is 6% and the average is 9.4%.