In this post we will each of the components that make up Publish MRR: new, reactivation, expansion, contraction, and churn. We’ll collect the data from ChartMogul and import it into this R session.
The data contains weekly MRR components for Publish from October 2017 to October 2019.
Net MRR Movement
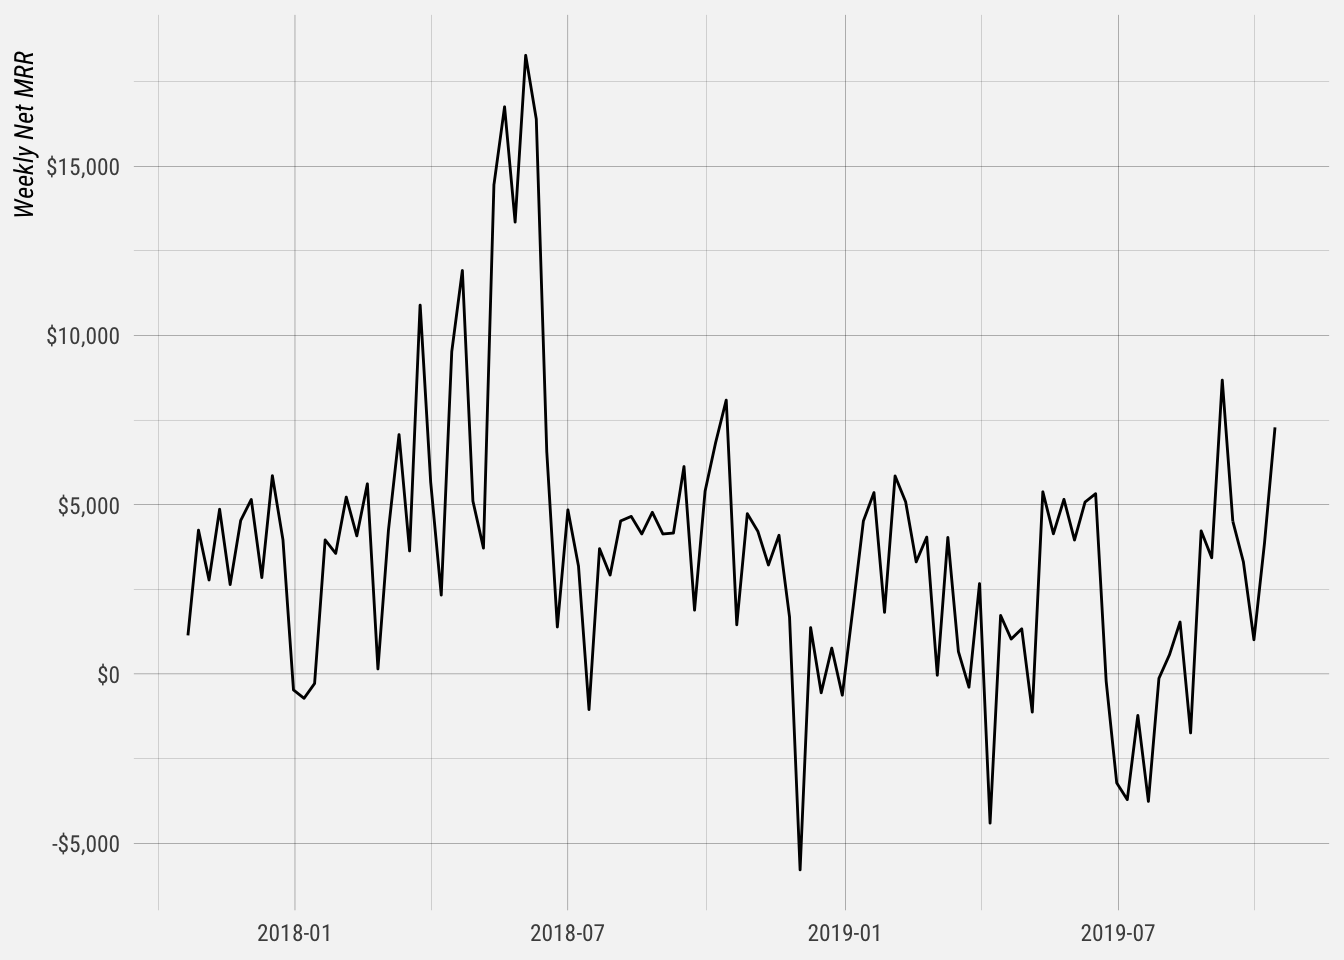
Let’s first look at net MRR movement. The plot below shows the net MRR movement for Publish for each week since October 2017. We can see that there was a period of high MRR growth in the beginning of 2018, around the time we offered the Awesome annual plan promotion and introduced the Pro plans. Since then, net MRR has trended downward somewhat.
Now let’s plot the distribution of net MRR.
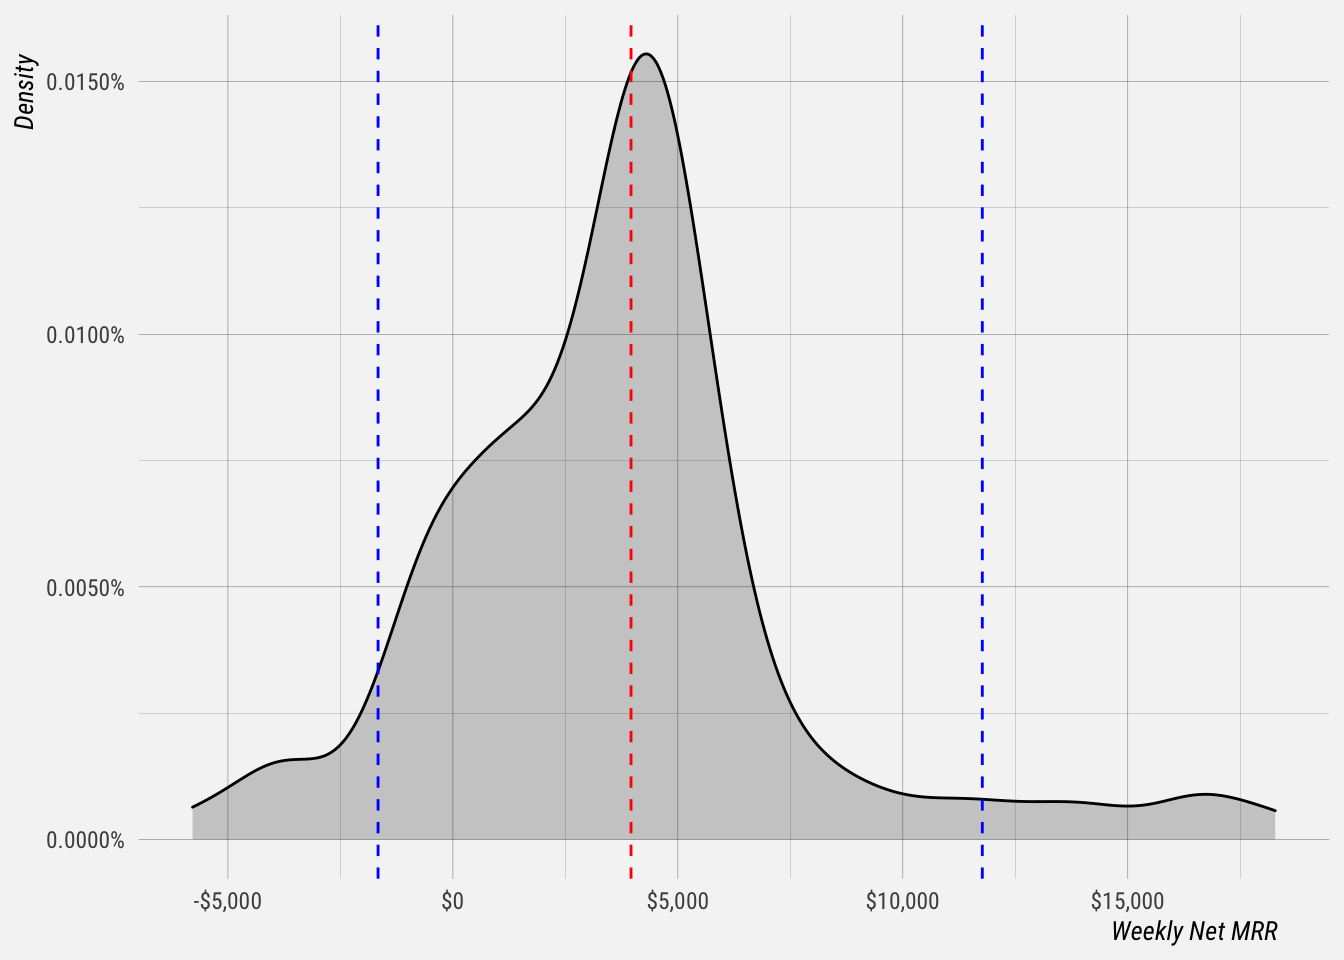
The blue lines represent the 5th and 95th quantile, and the red line represents the median. This means that we can expect net MRR for publish to be -$1638 or less around 5% of weeks. We can also expect it to be $11,713 or higher for around 5% of weeks. The median is $3959, so we can expect net MRR to be around there most often.
The standard deviation is $4107, which suggests that, on average, net MRR fluctuates by around $4k each week.
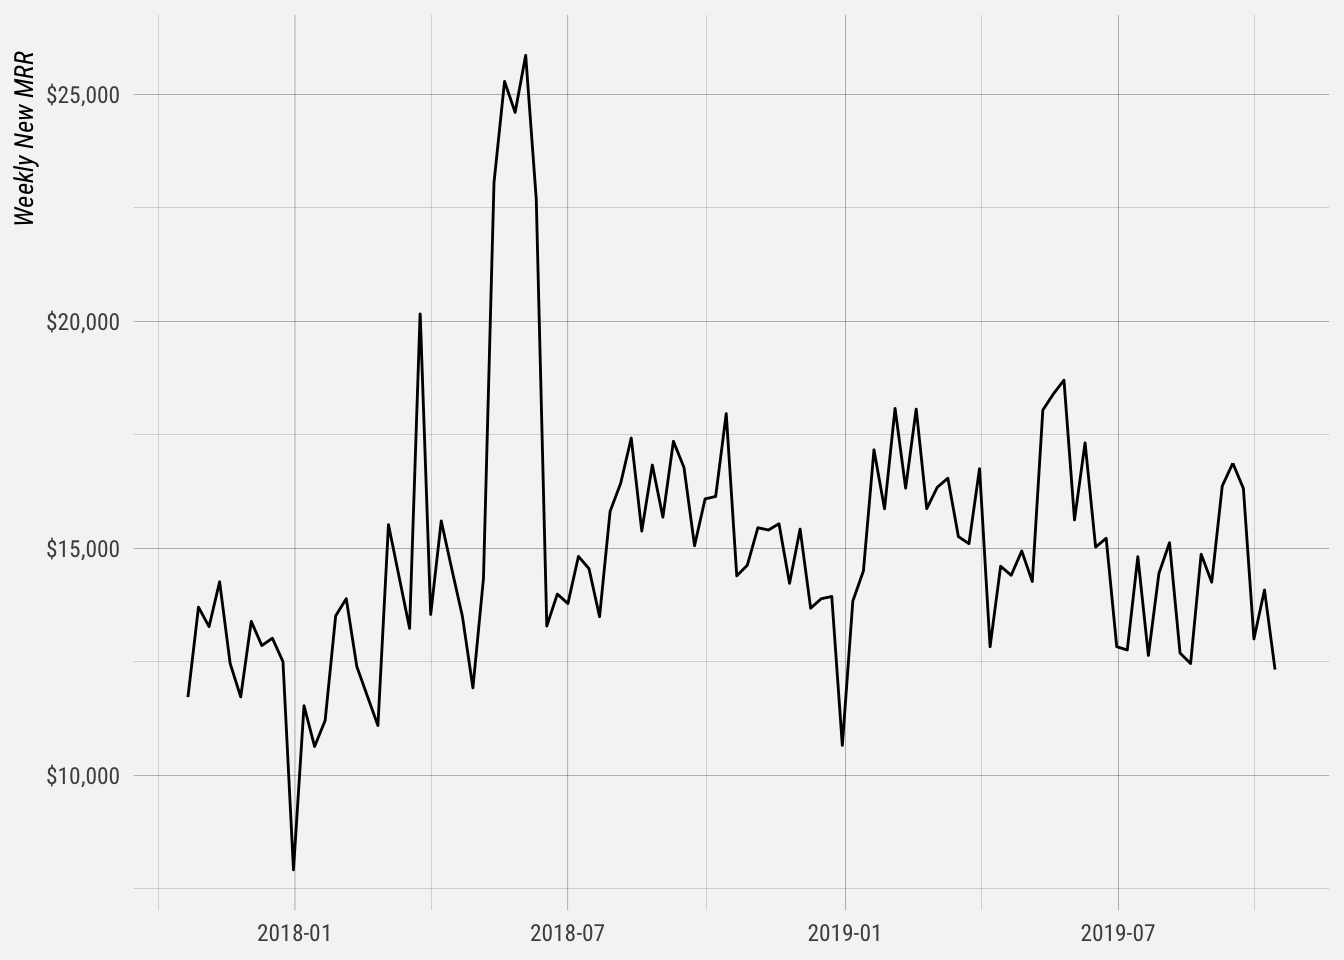
New MRR
Let’s take the same approach with New MRR. We can see that it’s been relatively stable over time, apart from the Spring of 2018.
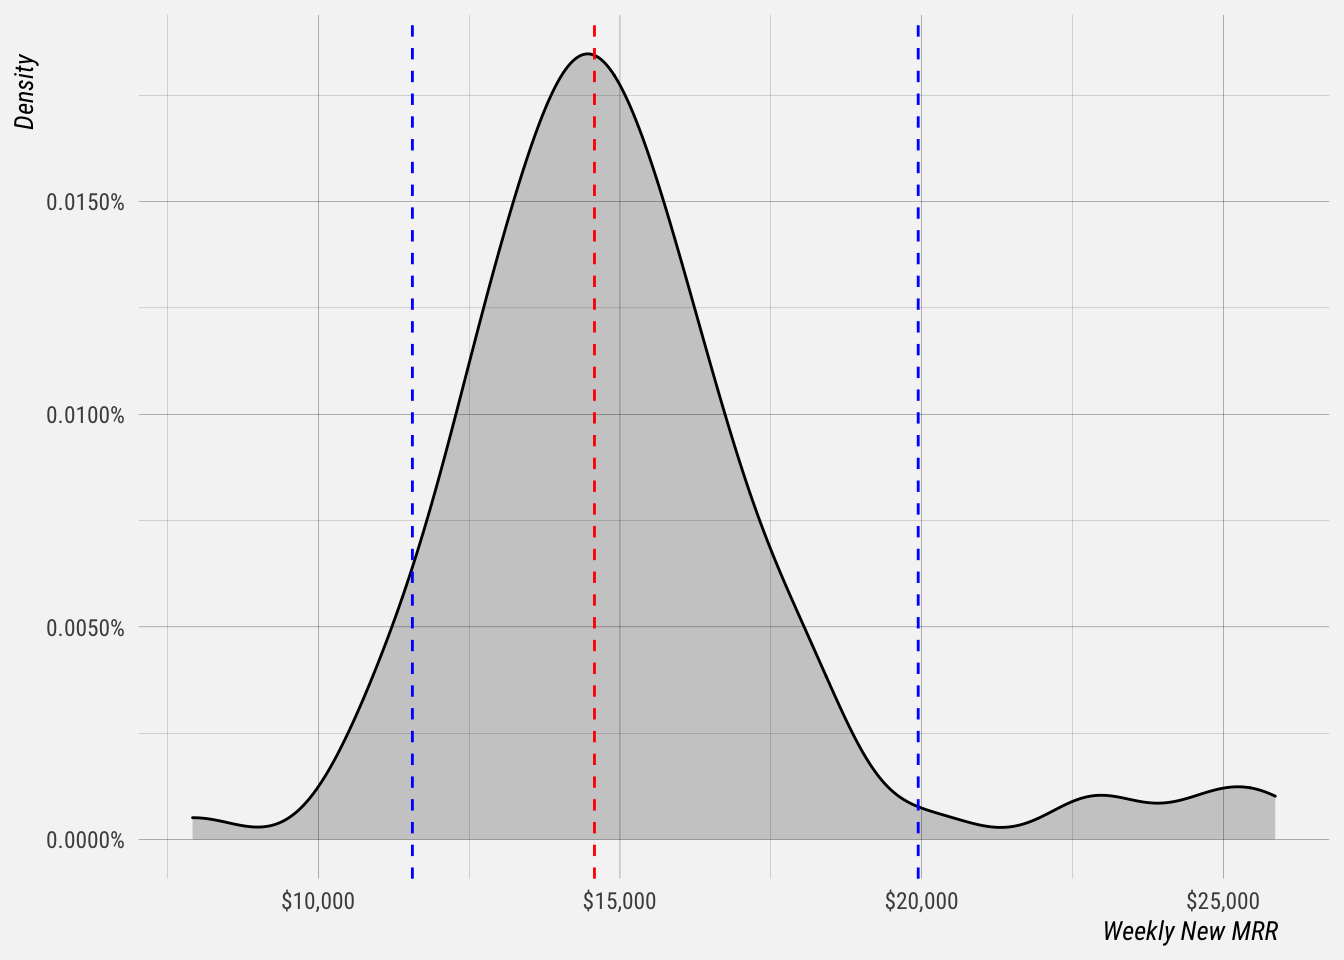
The distribution of New MRR looks more like a gaussian, which is good. The 5th quantile is at $11,272, so we can expect new MRR to be around $11k or less around 5% of weeks. The 95th quantile is at $19,869, so we can expect new MRR to be around $20k or higher around 5% of weeks.
The median is $14,550 and the standard deviation is $3k, which means that new MRR fluctuates by around $3k from week to week, on average.
Churn MRR
Let’s take a look at churn over time.
## `geom_smooth()` using formula 'y ~ x'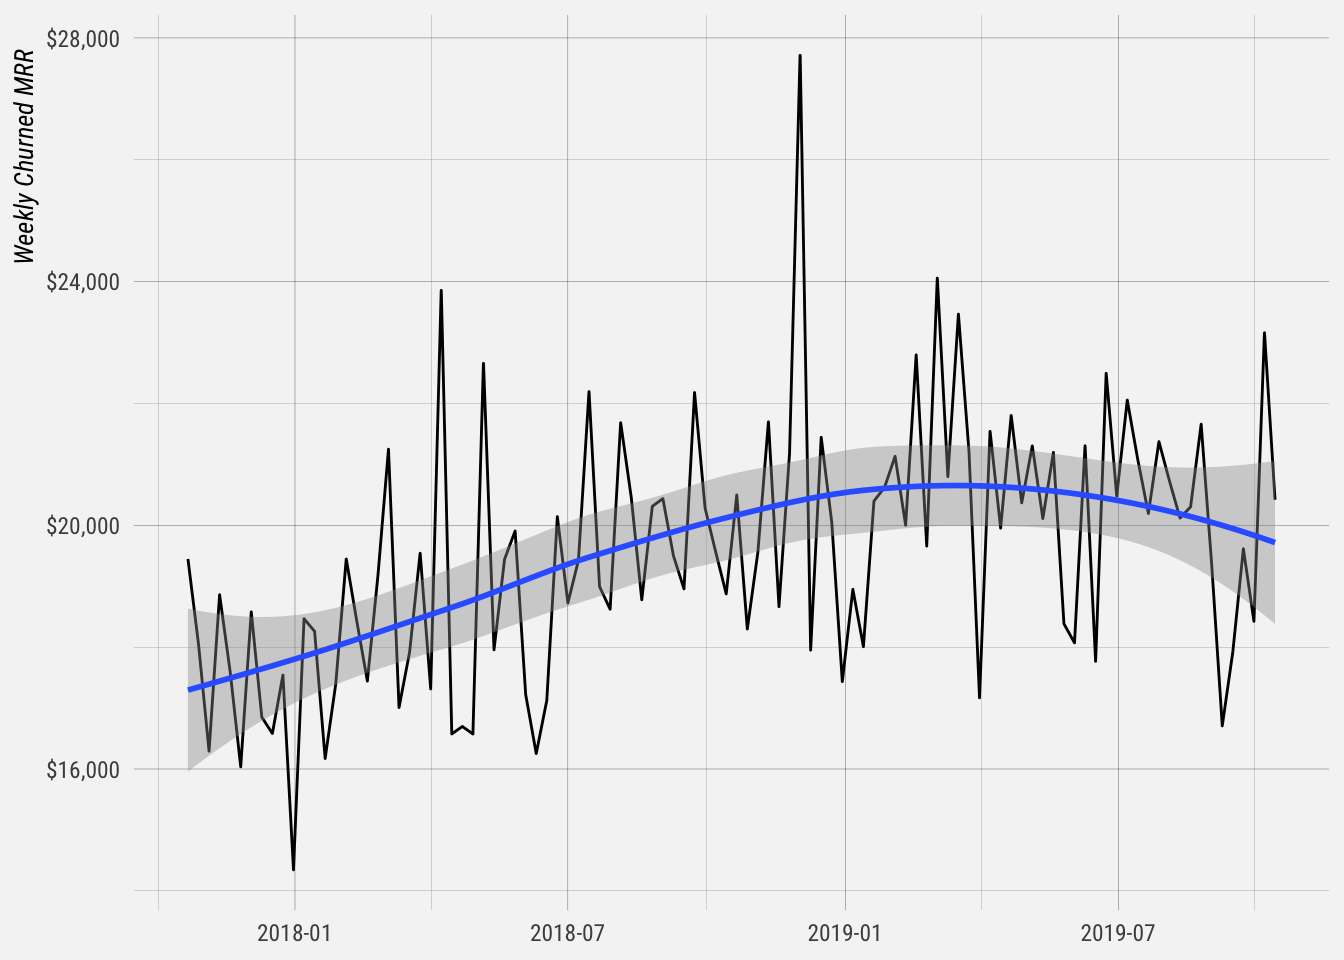
Let’s look at the distribution of weekly churned MRR.
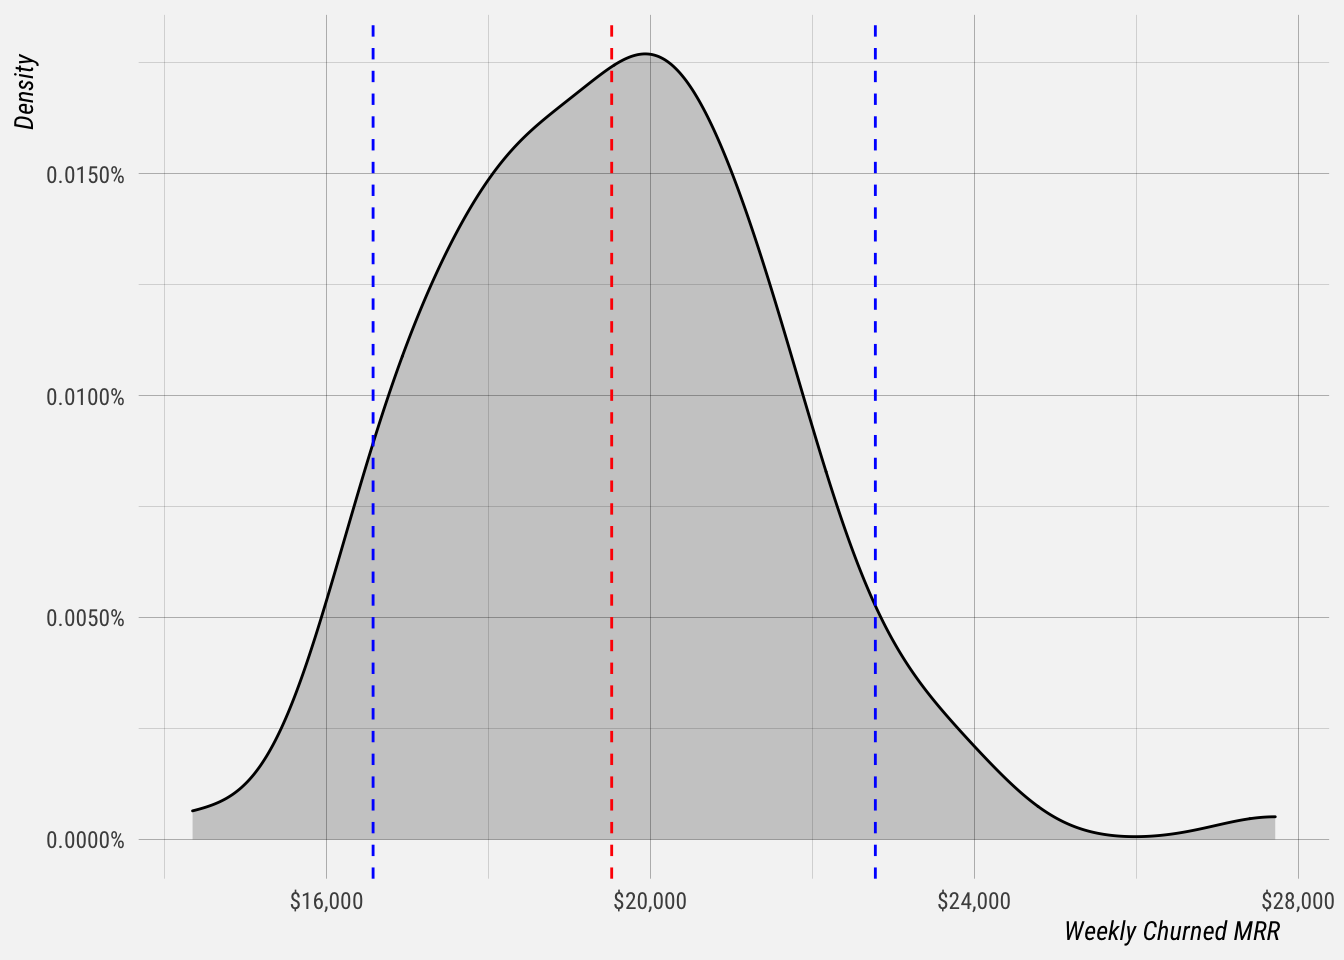
Weekly churned MRR is also roughly gaussian. The 5th quantile is at $16,575, so we can expect churned MRR to be around $16.5k or less around 5% of weeks. The 95th quantile is at $22,777, so we can expect churned MRR to be around $23k or higher around 5% of weeks.
The median is $19,520 and the standard deviation is $2.1k, which means that churned MRR fluctuates by around $2.1k from week to week, on average.
Reactivation MRR
Reactivation is when a previously paying customer that had churned moves back onto a paid plan. Let’s look at reactivation MRR over time.
## `geom_smooth()` using formula 'y ~ x'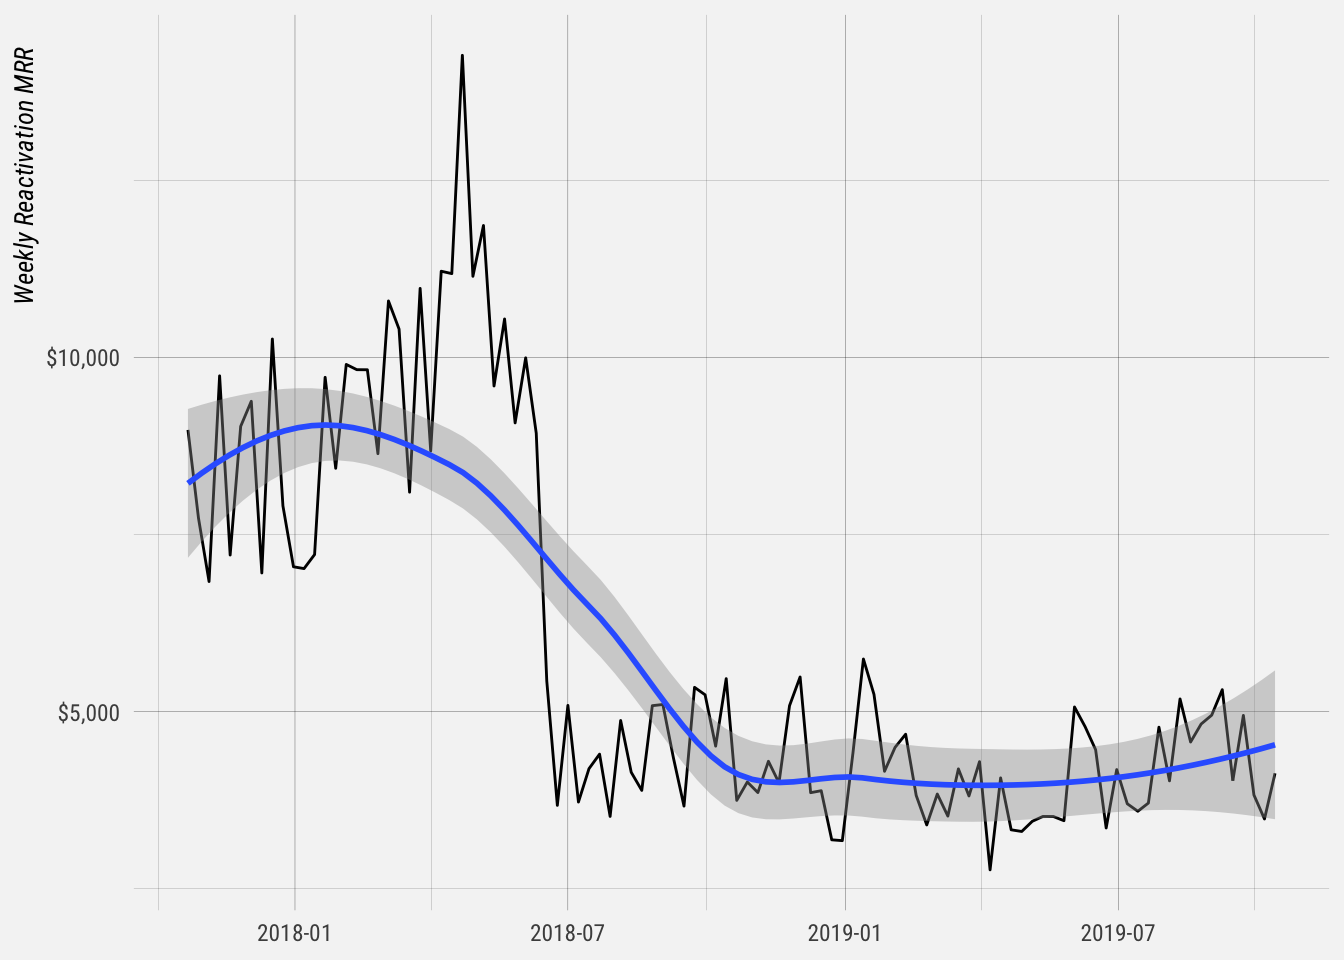
Wow, we did something that changed reactivation substantially in mid-2018. Let’s view the distribution, but only from weeks after July 2018.
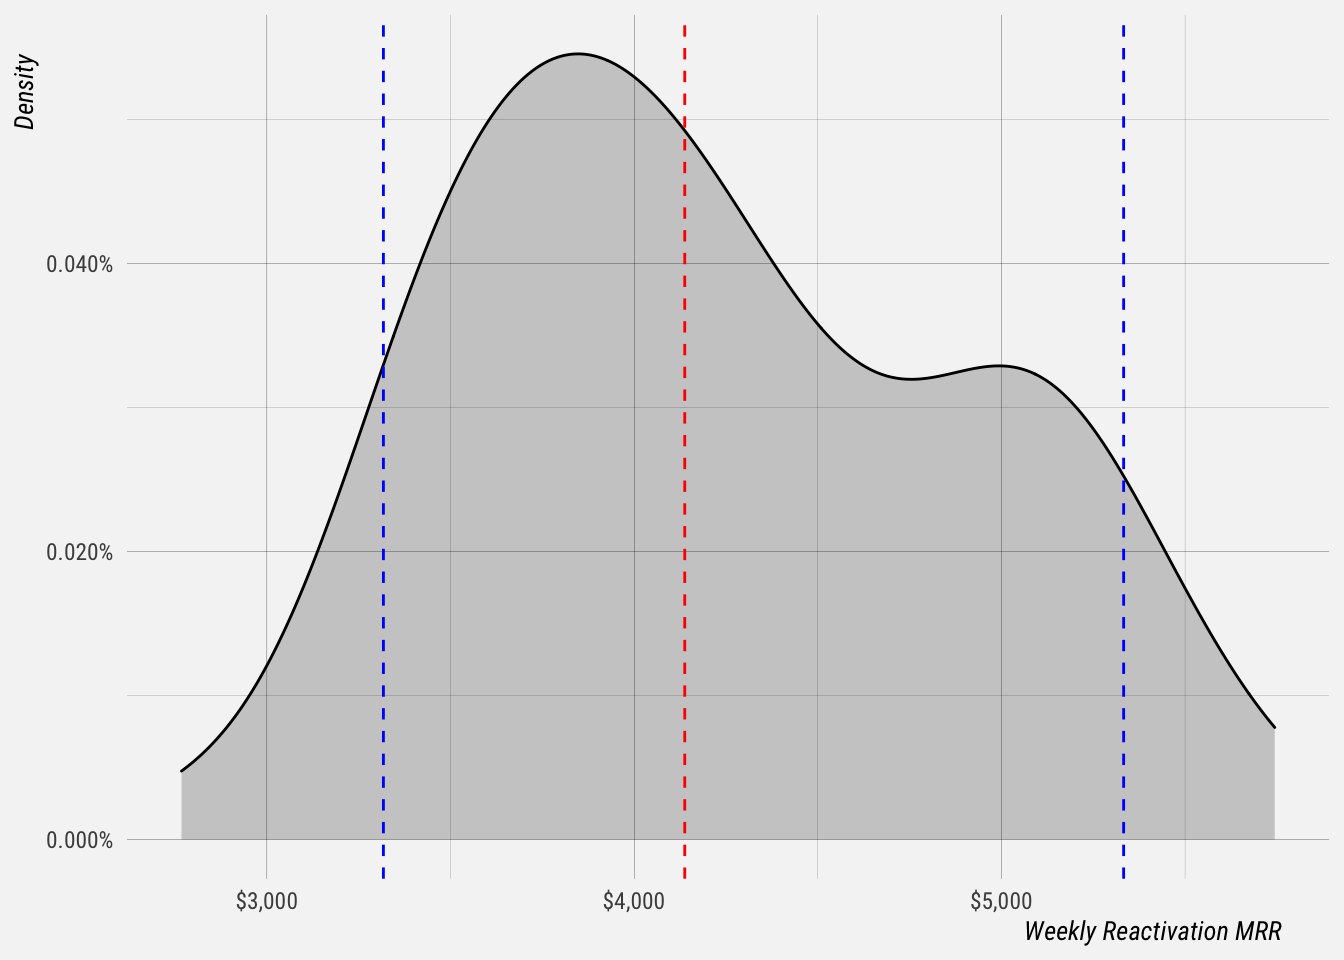
This is an interestingly shaped distribution. It almost appears bimodal. The 5th quantile is at $3317 and the 95th is at $5333.
The median is $4137 and the standard deviation is $689.
Expansion
Expansion revenue is defined as any increase in the MRR of an existing customer, e.g. an increase in quantity, upgrade to a higher plan, adding a 2nd subscription, or a discount expiring.
Over time expansion revenue has increased quite a bit!
## `geom_smooth()` using formula 'y ~ x'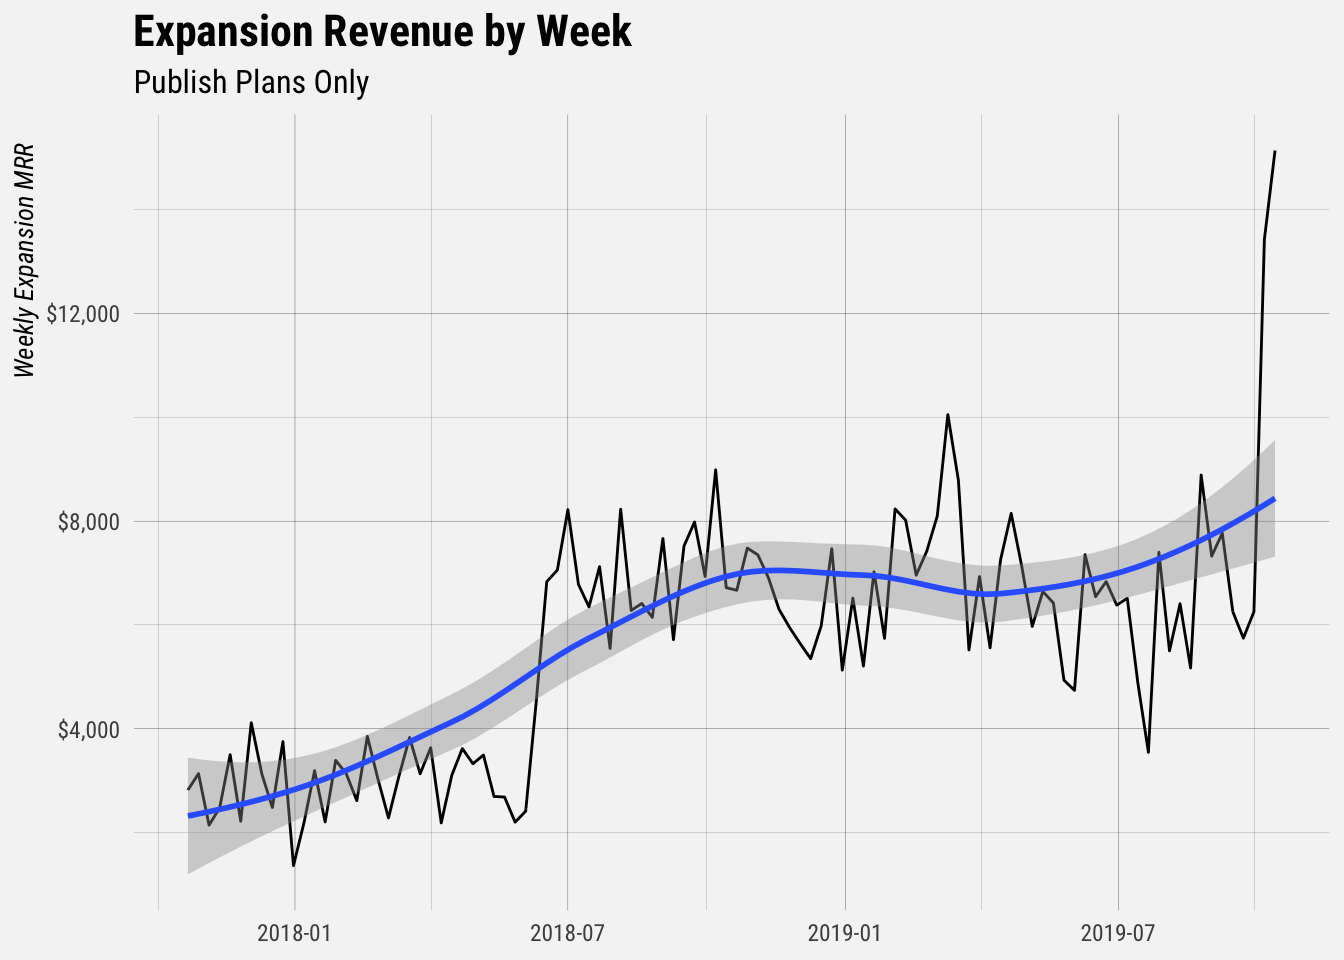
Now let’s look at the distribution.
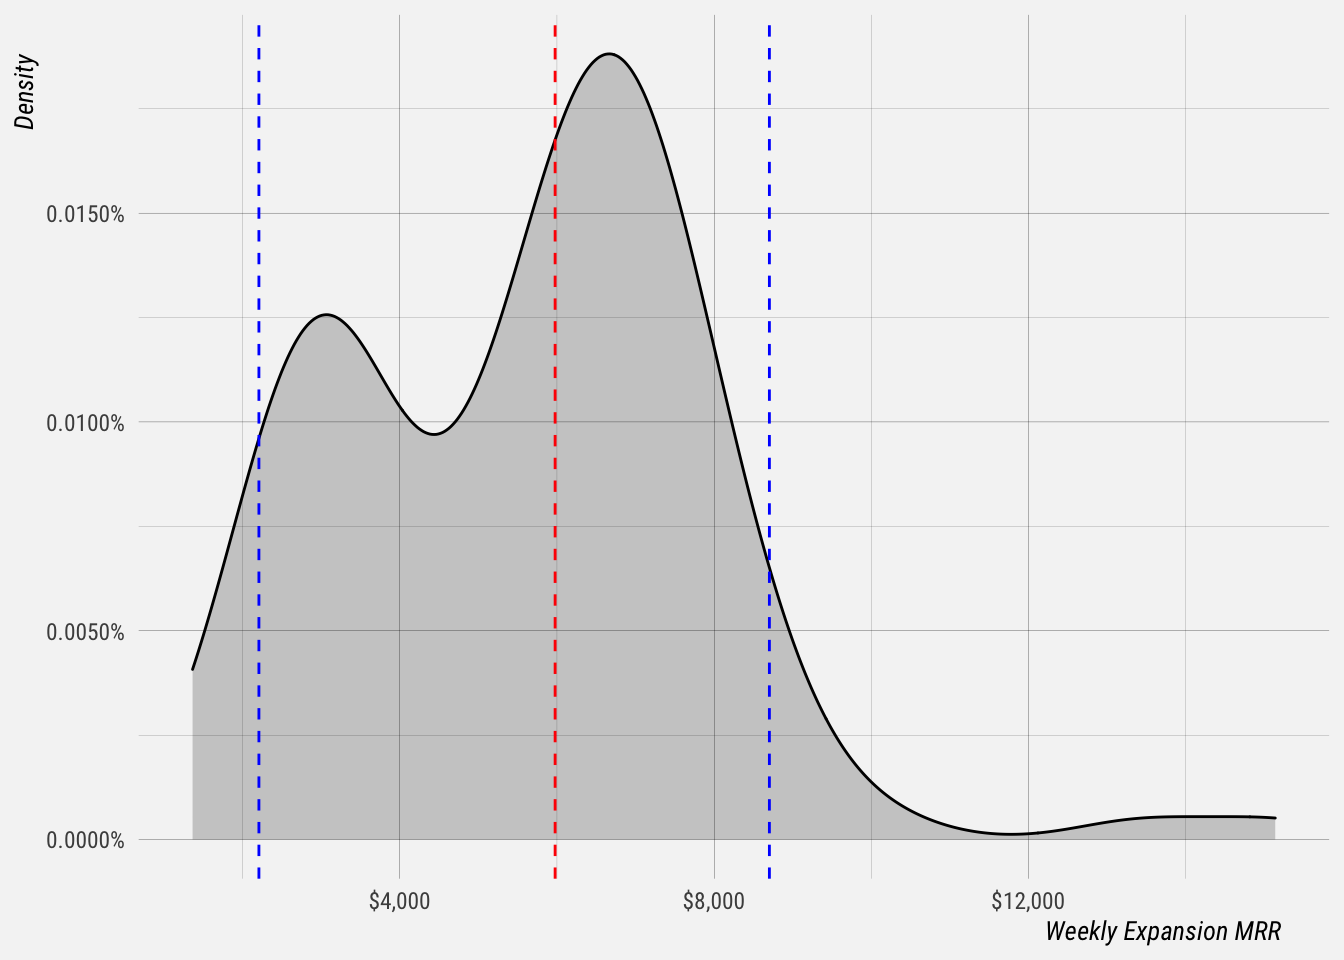
Expansion MRR also appears to be bimodal, which makes sense given the abrupt shift seen in the first graph. Let’s only look at data since July 2018.
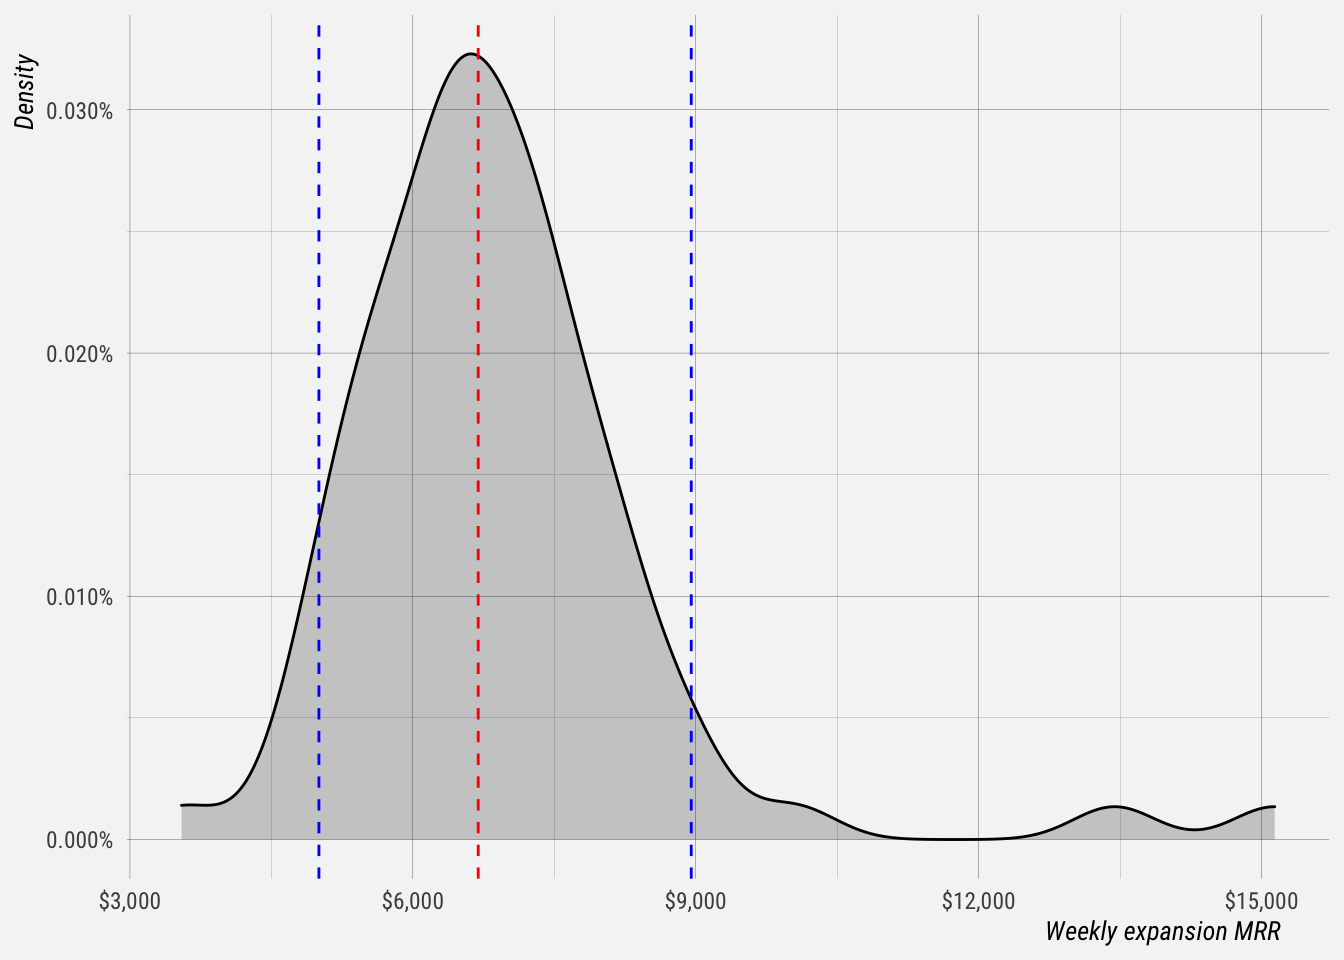
That looks better. The 5th quantile is at $5004 and the 95th quantile is at $8952. The median is $6693 and the standard deviation is $1735.
Contraction
Contraction is defined as any decrease in MRR. e.g. a decrease in quantity, downgrade to a lower plan, or a discount being added. Let’s see how it’s changed over time.
## `geom_smooth()` using formula 'y ~ x'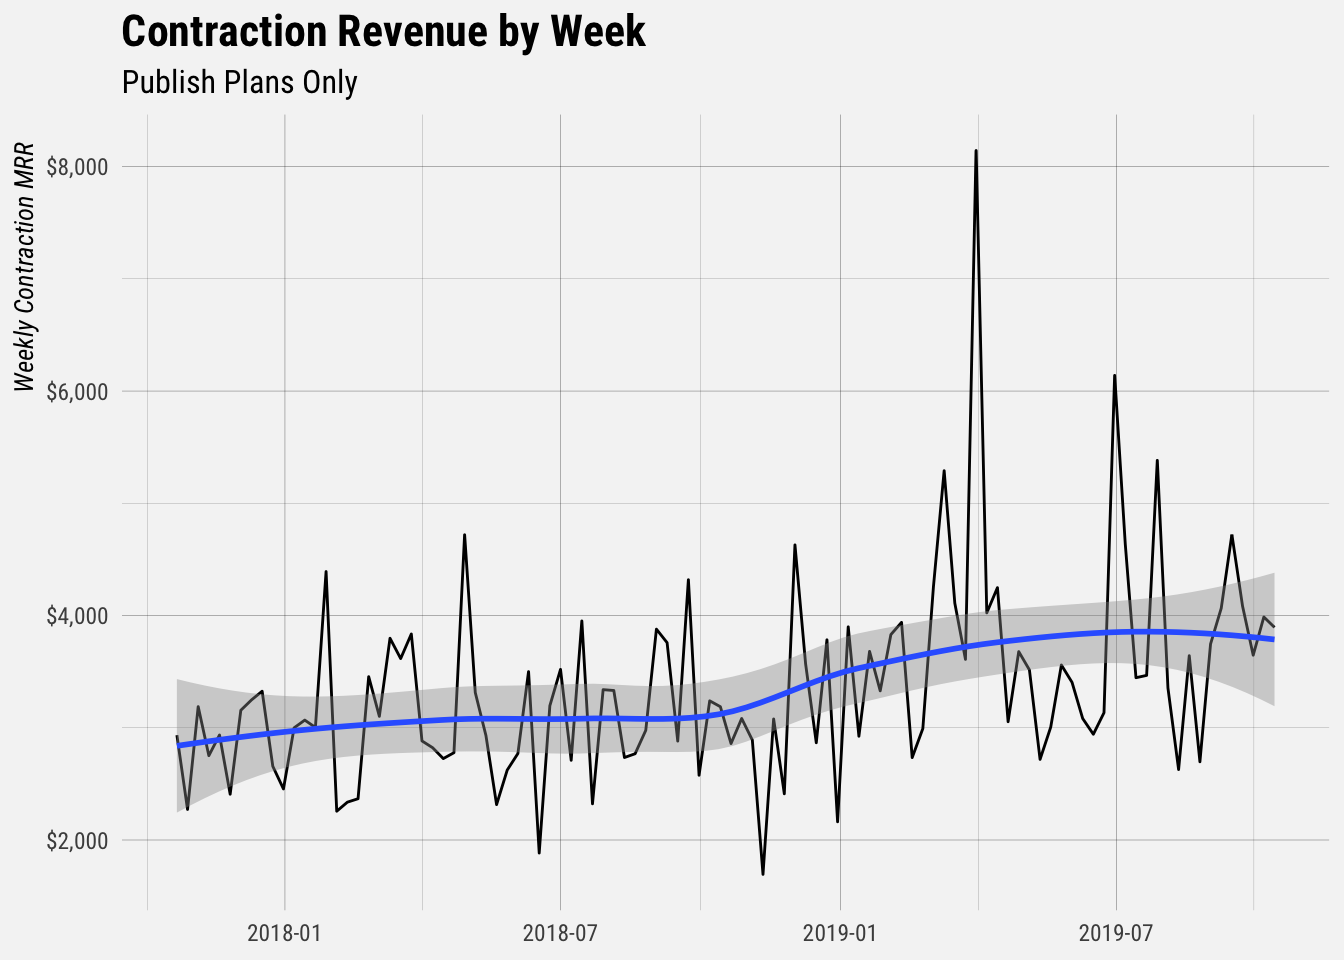
Now let’s see the distribution.
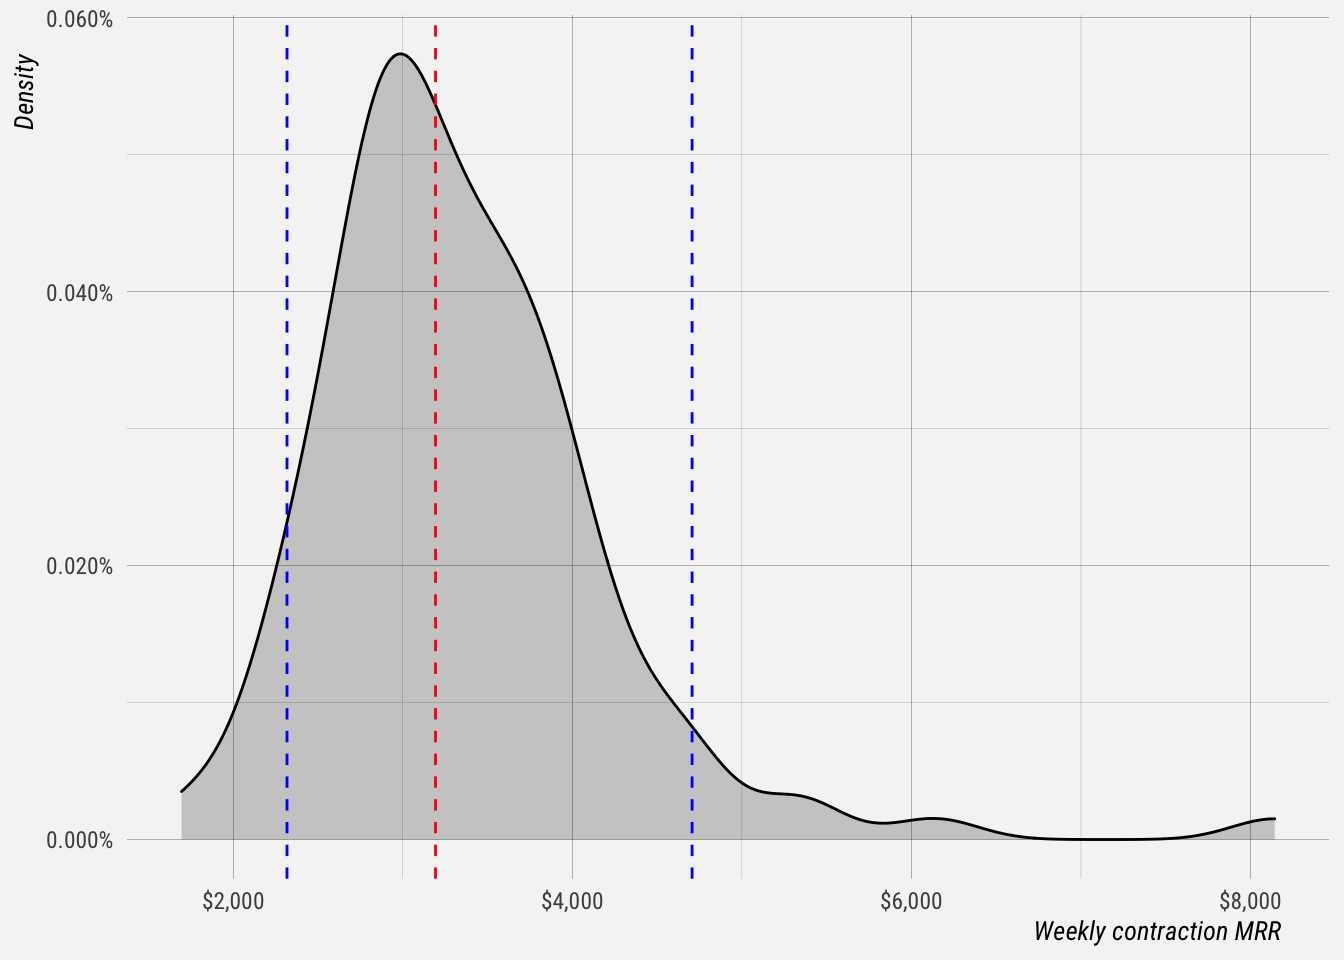
The 5th quantile is at $2316 and the 95th is at $4706. The median is $3192 and the standard deviation is $882.