In this analysis we will look at the correlation between the number of followers that a channel has and the probability of the channel’s owner subscribing to a paid subscription.
My hypothesis is that there is a reasonably strong correlation between follower counts and the likelihood of converting. This makes intuitive sense, since those users with significant follower counts can make more use of Buffer’s solutions like Analyze and Engage. I would guess that users would be more invested in Publishing content to those followers as well.
I hope to use this analysis as futher evidence to encourage the team to start collecting follower count data when channels are connected to Buffer.
One caveat I should mention is that the data used in this analysis largely comes from the followers_count table in MongoDB. Some Publish channels have follower count data, but many do not. Of the 1.39 million channels connected to Publish in 2020, only 113K (8%) have followers data.
I do not know when and why we collect followers data for this subset of channels, and it may be true that this dataset is biased. For the sake of the analysis we will assume that we collect followers data for channels at random.
Summary of Findings
There is a strong correlation between the number of followers a user’s channel has and the likelihood of the user converting to a paid subscription. The correlation is strong for each channel, but appears to be strongest for Instagram and Facebook channels.
Based on these findings, I would encourage the team to start collecting follower counts data for all channels that are connected to Buffer.
Data Exploration
The code to collect the data has been hidden so that this document is more readable. The dataset only includes Publish users that signed up in 2020 and connected channels for which we have followers data. Here’s a glimpse of what it looks like.
# glimpse data
glimpse(users)
## Rows: 80,311
## Columns: 6
## $ user_id <chr> "5e2e15651262df130f200d84", "5f78fa8146eb2209e2587693…
## $ signup_date <date> 2020-01-26, 2020-10-03, 2020-05-12, 2020-06-23, 2020…
## $ profile_id <chr> "5e4ef2ded2139c2b3a41d4eb", "5f78fc079580fd5c206f60a6…
## $ profile_service <chr> "twitter", "twitter", "twitter", "twitter", "twitter"…
## $ max_followers <int> 68, 6, 3, 1191, 3488, 10204, 25, 4, 60, 24, 279511, 1…
## $ paid_subs <int> 2, 0, 0, 0, 2, 2, 0, 0, 0, 0, 2, 2, 0, 0, 0, 1, 1, 0,…For each profile service, let’s plot the distribution of the number of followers.
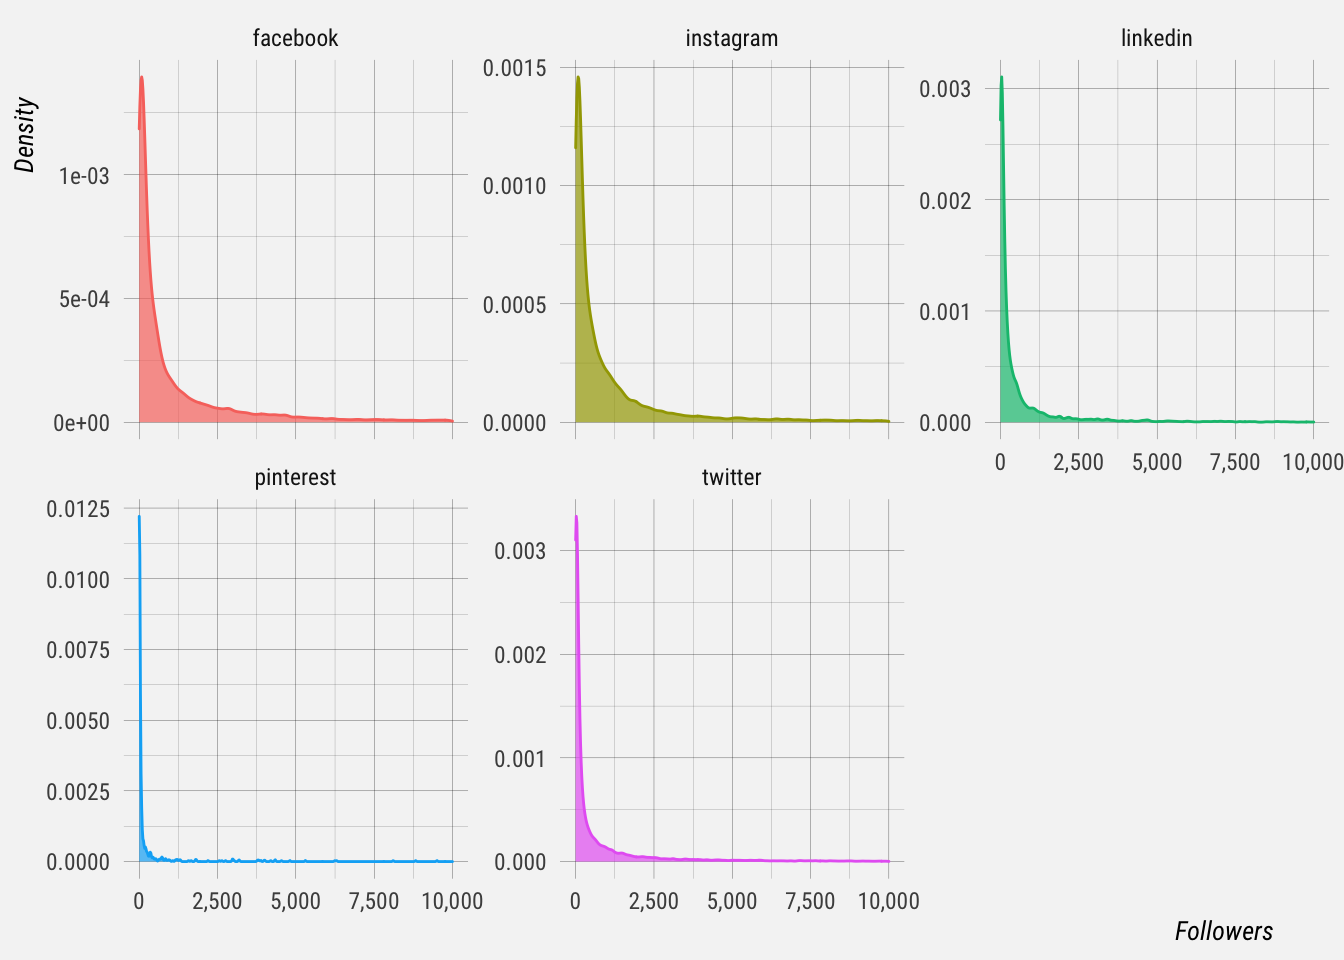
Unsurprisingly, the follower counts follow a power-law distribution, with many channels having very few followers and a few channels having a large number of followers. One way to address this is to put channels into “buckets”. There can be a bucket for 0-100 followers, one for 101-1000 followers, etc.
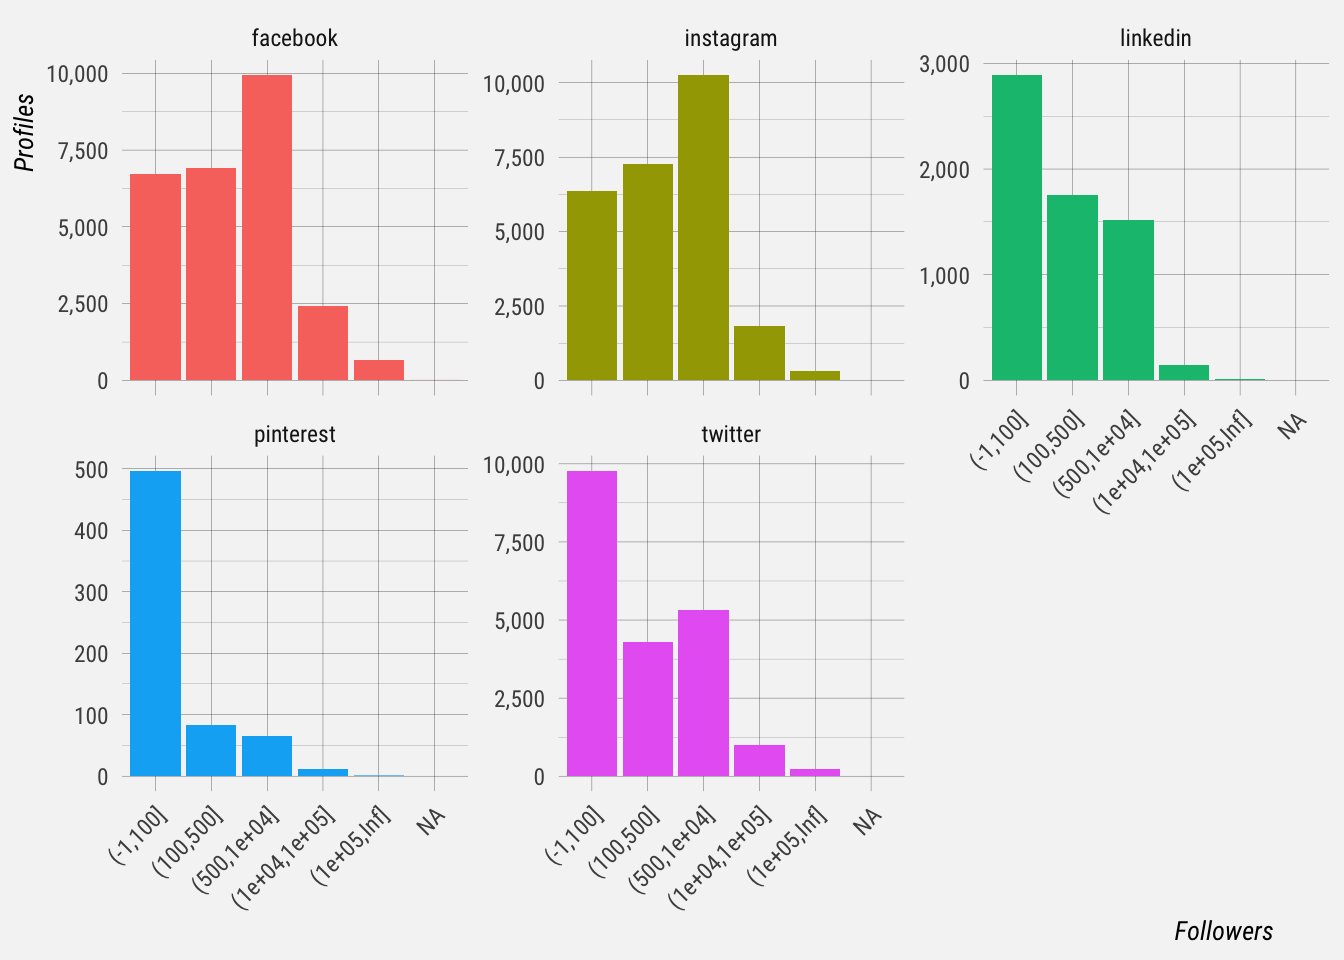
We can see here that the follower counts of Facebook and Instagram channels tend to be distributed differently than Twitter, Pinterest, and Linkedin channels. Facebook and Instagram profiles tend to have more followers when they’re connected.
Correlation With Converting
Now let’s see if follower counts are correlated with the probability of paying for a Buffer subscription. We’ll make use of these follower buckets again.
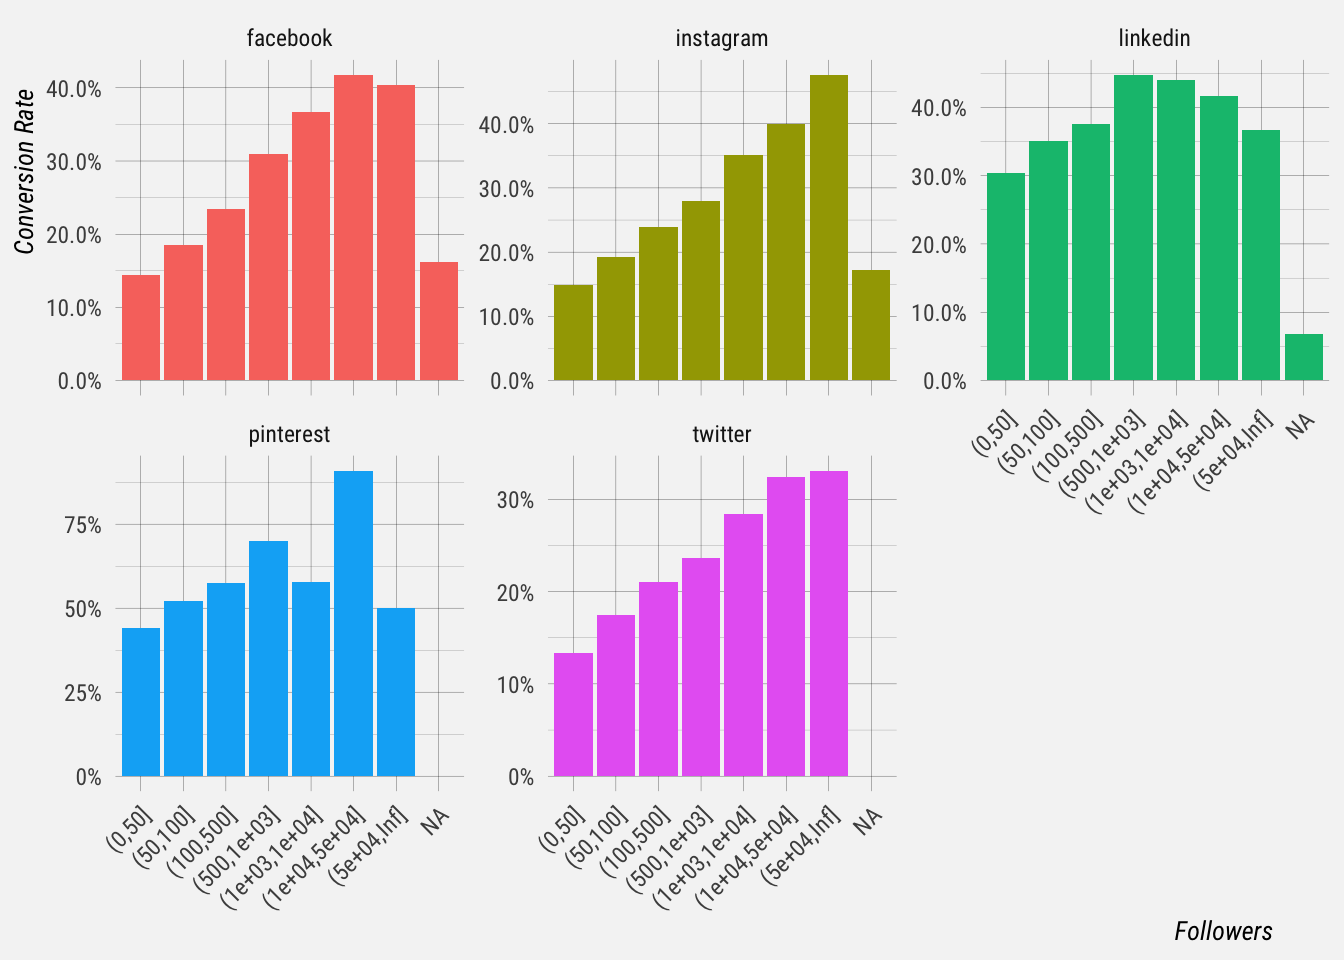
We can see that there appears to be a strong correlation, particularly for Facebook and Instagram profiles. Conversion rates for those users with 0-50 followers is around 15%, compared to > 40% for those with 50,000 followers or more.
I should note that there may be users with multiple profile types that influence multiple plots. For example a single user may have an Instagram channel with many followers as well as a Facebook channel with many followers. That single user would contribute to the high conversion rate in both the Facebook and Instagram graphs.
We can also compare the distributions of follower counts for Instagram profiles only. Because the counts are distributed according to a power-law distribution, we’ll use the log of the follower counts in the visualization.
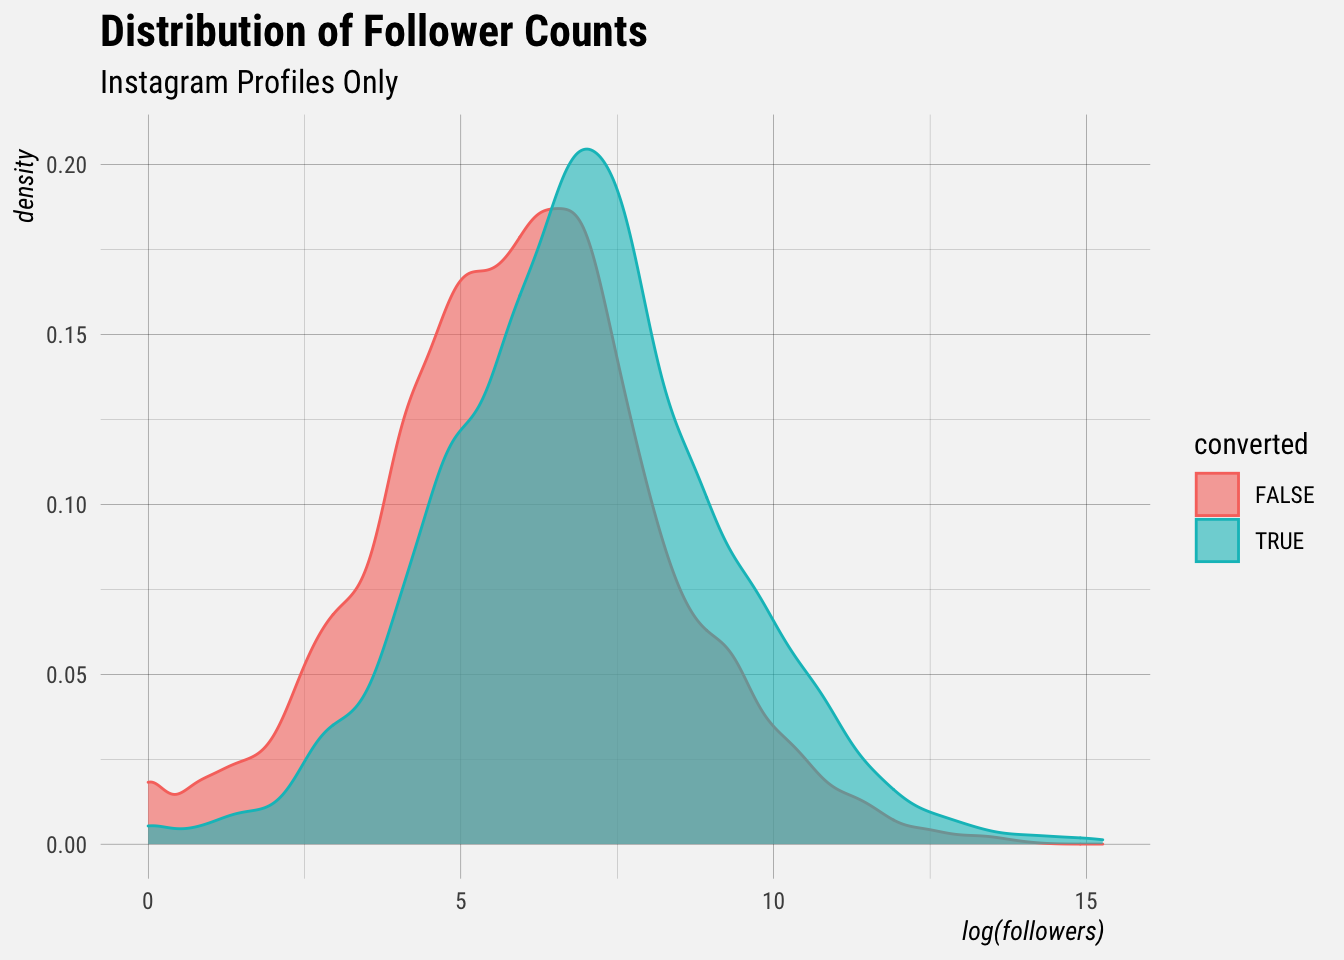
We can see that the distribution of followers for converted is clearly shifted to the right, which suggests that converted users tend to have more followers for their Instagram accounts.
Next let’s fit a very basic general linear model to summarise the relationship between the follower counts and the (log) likelihood of converting. Because the relationship between follower counts and converting is non-linear, we’ll scale and center the follower counts to try to account for the high variance.
# fit glm
glm_fit <- glm(converted ~ scale(max_followers),
               data = by_user,
               family = "binomial")

# summarise fit
summary(glm_fit)
##
## Call:
## glm(formula = converted ~ scale(max_followers), family = "binomial",
## data = by_user)
##
## Deviance Residuals:
## Min 1Q Median 3Q Max
## -2.6357 -0.7856 -0.7856 1.6258 1.6285
##
## Coefficients:
## Estimate Std. Error z value Pr(>|z|)
## (Intercept) -1.014787 0.009743 -104.154 < 2e-16 ***
## scale(max_followers) 0.049107 0.012597 3.898 9.69e-05 ***
## ---
## Signif. codes: 0 '***' 0.001 '**' 0.01 '*' 0.05 '.' 0.1 ' ' 1
##
## (Dispersion parameter for binomial family taken to be 1)
##
## Null deviance: 62532 on 53971 degrees of freedom
## Residual deviance: 62510 on 53970 degrees of freedom
## AIC: 62514
##
## Number of Fisher Scoring iterations: 4The model suggests that the follower counts may be a very significant predictor of the likelihood of converting. There are likely other confounding factors, but this model fit still suggests a strong correlation if not a causal relationship.
Summary
Based on this simple primary analysis, I believe that the follower counts of channels that users connect are strong predictors of the likelihood of success. I would encourage the team to start collecting follower counts data for all channels that are connected to Buffer in the future.