In this analysis we’ll try to understand who Buffer’s monthly active users are and how they’re using the product. The sample of users we’ll be looking at took a key action, defined as one of creating a post, viewing analytics, or replying to an Instagram comment, between November 1, 2020 and December 1, 2020.
We’ll be looking at when the users’ accounts were created, how many key actions they took, which clients they used, how often they were active, what types of companies they represent, how many are paying customers, and what platforms they use Buffer on.
It should be noted that this analysis is of monthly active users at a given point in time, i.e. December 1, 2020. In order to simplify the analysis, we assume that the conclusions drawn from this cohort apply to monthly active users generally.
Conclusions
Buffer’s monthly active users are made up mostly of Publish users. There is a mix of paying customers and free users, with around 25% of MAUs currently paying for a Publish subscription.
There is also a mix of new and old users. More than half of MAUs created accounts over a year and a half ago. This differs for each product – Analyze users tend to be younger and Engage users skew older.
Almost 30% of MAUs were active in only one week of the month. Around 17% were active two weeks, 13% three weeks, and 26% were active in all five weeks. A quarter were only active on one day of the month and 50% were active three days or fewer.
Of the Publish MAUs, around 70% were exclusively web users, 17% were mobile-only users, and 12.7% created posts on mobile and web.
Of MAUs that filled out the target customer survey, most were agencies or publishers, and the vast majority had five or fewer team members in the organization.
Somewhat surprisingly, almost half of all MAUs haven’t been on a trial. Over 10% have been on multiple trials.
Active Users by Product
Let’s start by breaking down the 169K monthly active users (MAUs) by the key action they took. This will indicate which products are used most.
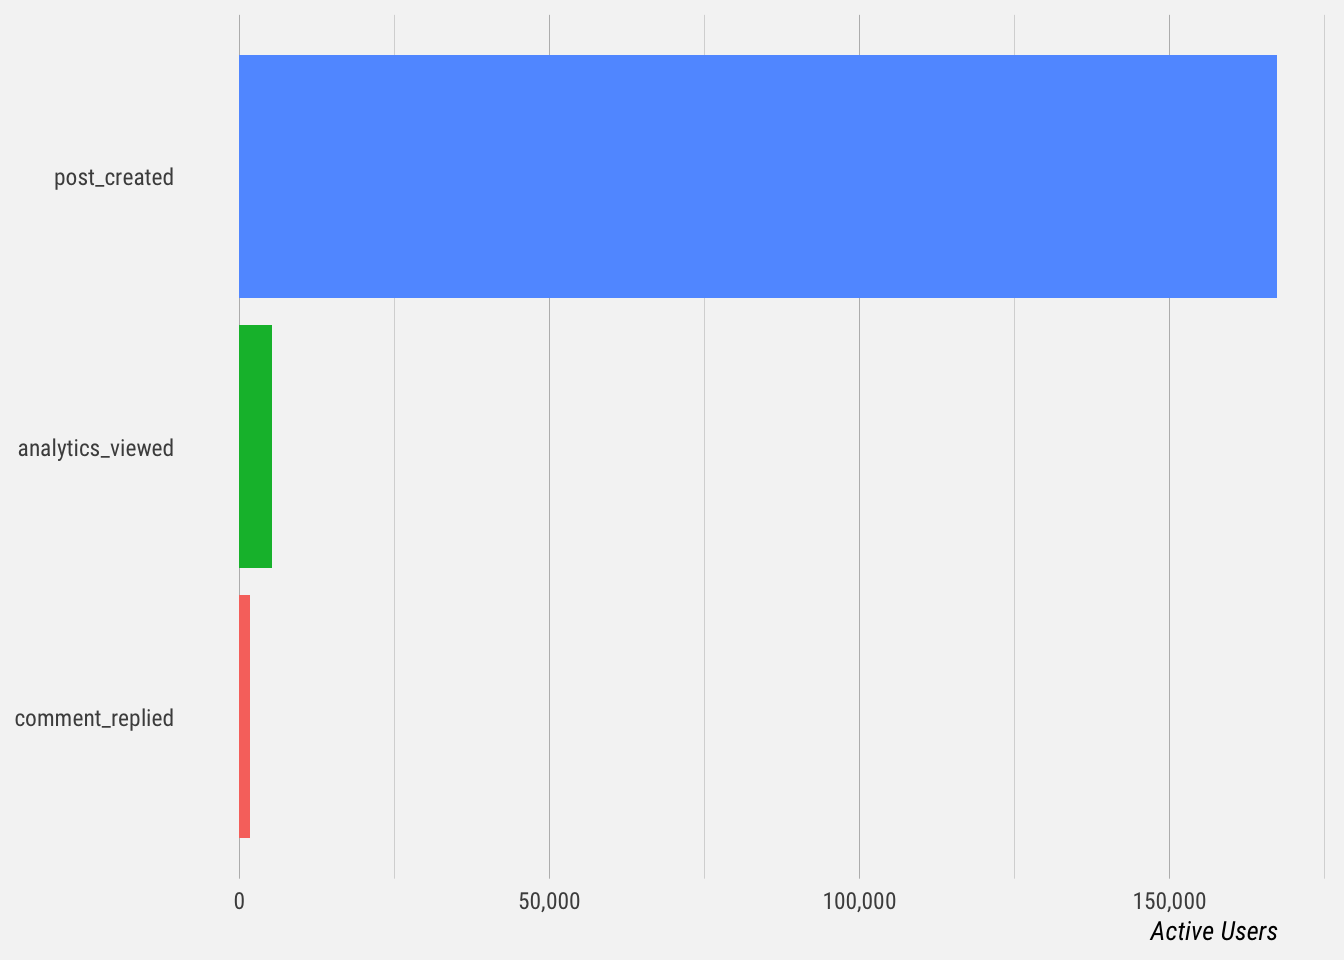
Unsurprisingly, the vast majority of MAUs were active in Publish. Around 96% of MAUs created a post, around 0.95% replied to a comment in Engage, and around 3% took a key action in Analyze. Let’s see how many took key actions in multiple products.
# count products used
actions %>%
  group_by(user_id) %>%
  summarise(products = n_distinct(event, na.rm = TRUE)) %>%
  group_by(products) %>%
  summarise(users = n_distinct(user_id)) %>%
  mutate(percent = scales::percent(users / sum(users)))
## # A tibble: 3 x 3
## products users percent
## <int> <int> <chr>
## 1 1 164782 97.3%
## 2 2 4311 2.5%
## 3 3 274 0.2%Around 97% of MAUs took a key action in a single product, 2.5% took key actions in two products, and 274 good people took key actions in all three.
Age of Accounts
Next let’s try to get a better understanding of how long MAUs have been using Buffer. We’ll start by estimating the age of the accounts and plotting the distributions.
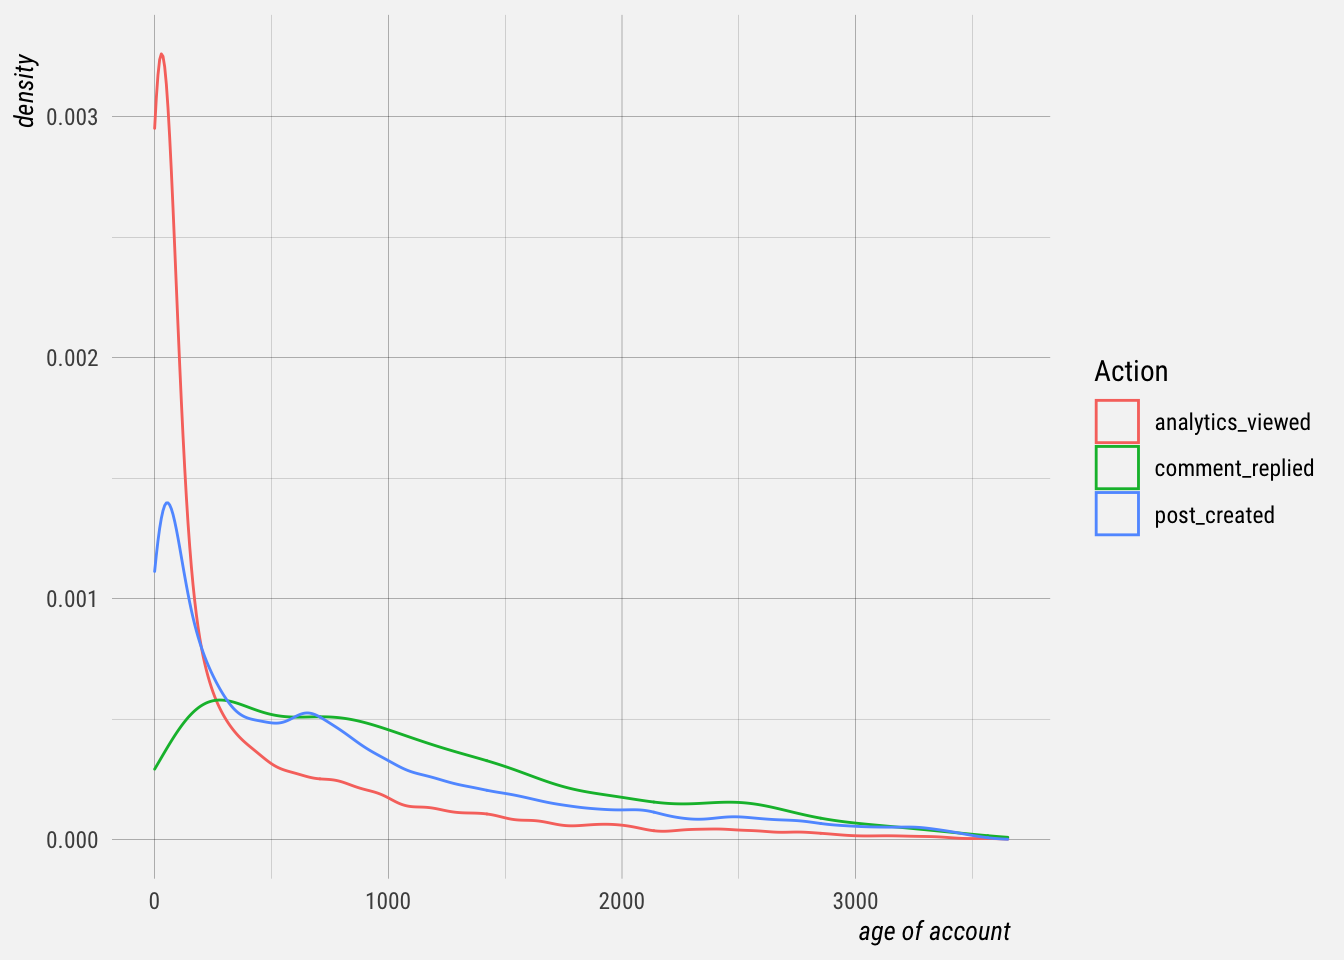
The distributions have a peak close to 0 (representing new accounts) and a long tail of older accounts. The distributions differ for users of the different products.
MAUs for Analyze skew much more towards newer accounts, whereas MAUs for Engage skew older. For Engage this is probably because we granted access to existing Business customers first.
Another way to get more information from this distribution would be to plot its cumulative distribution function (CDF).
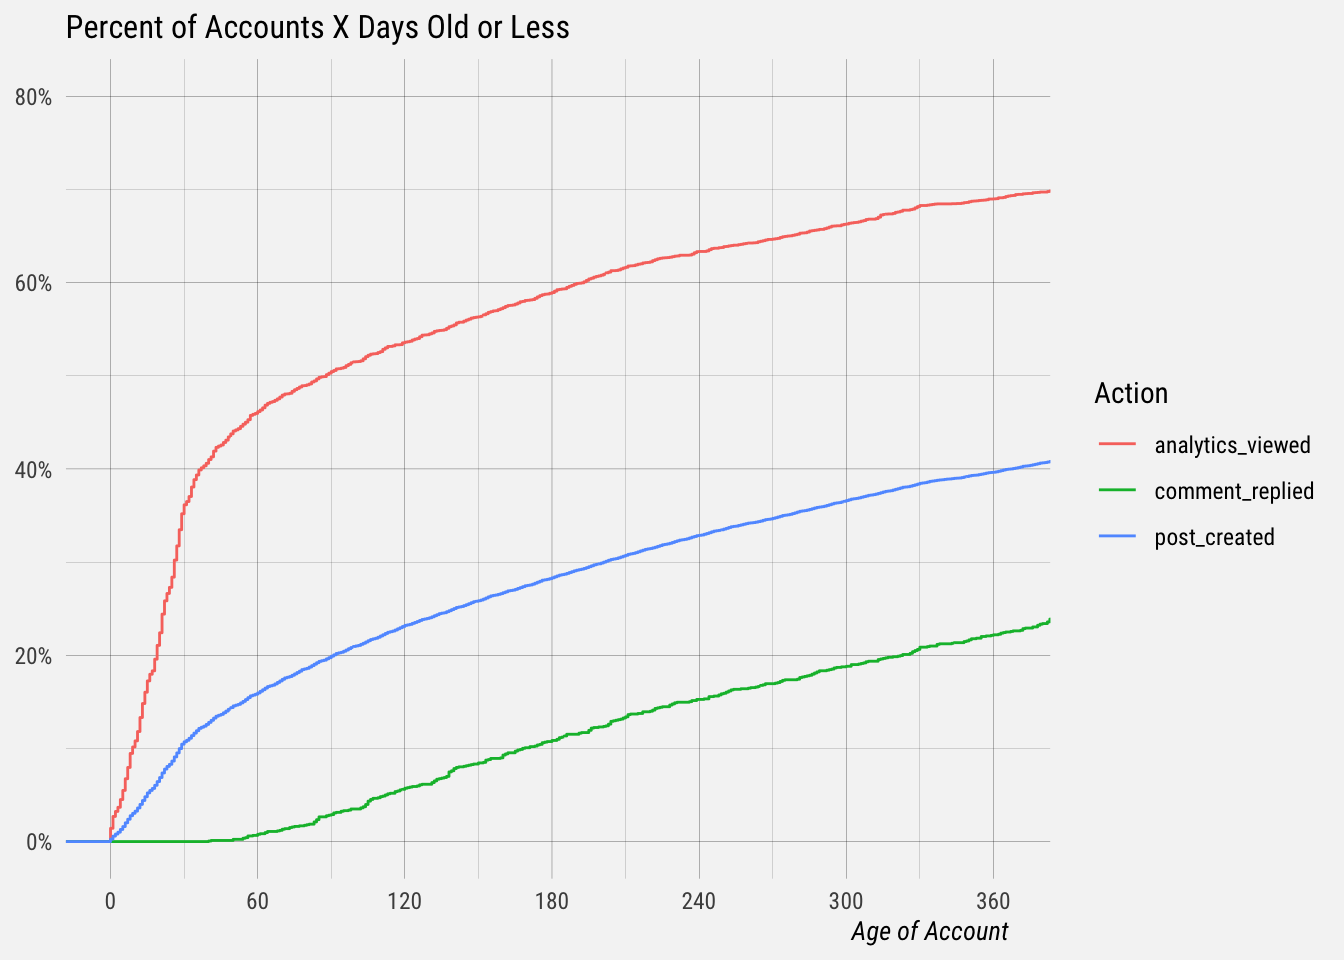
This plot shows us the percentage of MAUs that have an account X days old or less. For example, around 11% of Publish MAUs have an account that was created in the 30 days prior. Inversely, 89% of Publish MAUs have accounts that were older than 30 days.
Less than 20% of Publish MAUs signed up in the previous 60 days, and only around 41% of MAUs signed up in the previous year!
Engage MAUs are even older, presumably because they are a subset of Publish MAUs that were on a Business plan.
Analyze MAUs were much younger. Around 35% created accounts in the previous 30 days and around 46% created accounts in the previous 60 days.
Let’s calculate some quantiles to summarise the age of accounts.
# calculate quantiles
actions <- actions %>%
  mutate(age = as.numeric(as.Date("2020-12-01") - signup_date))

quantile(actions$age, na.rm = T)
## 0% 25% 50% 75% 100%
## 0 134 561 1191 3651Around 25% of MAU accounts are 134 days old or less. The median account age is 561 days. Around 75% of accounts are 1191 days old or less, and the oldest account is 3651 days old!
How Often MAUs Were Active
Now let’s plot the distributions of the number of days and weeks MAUs were active. We’ll only look at accounts created before November 1, 2020.
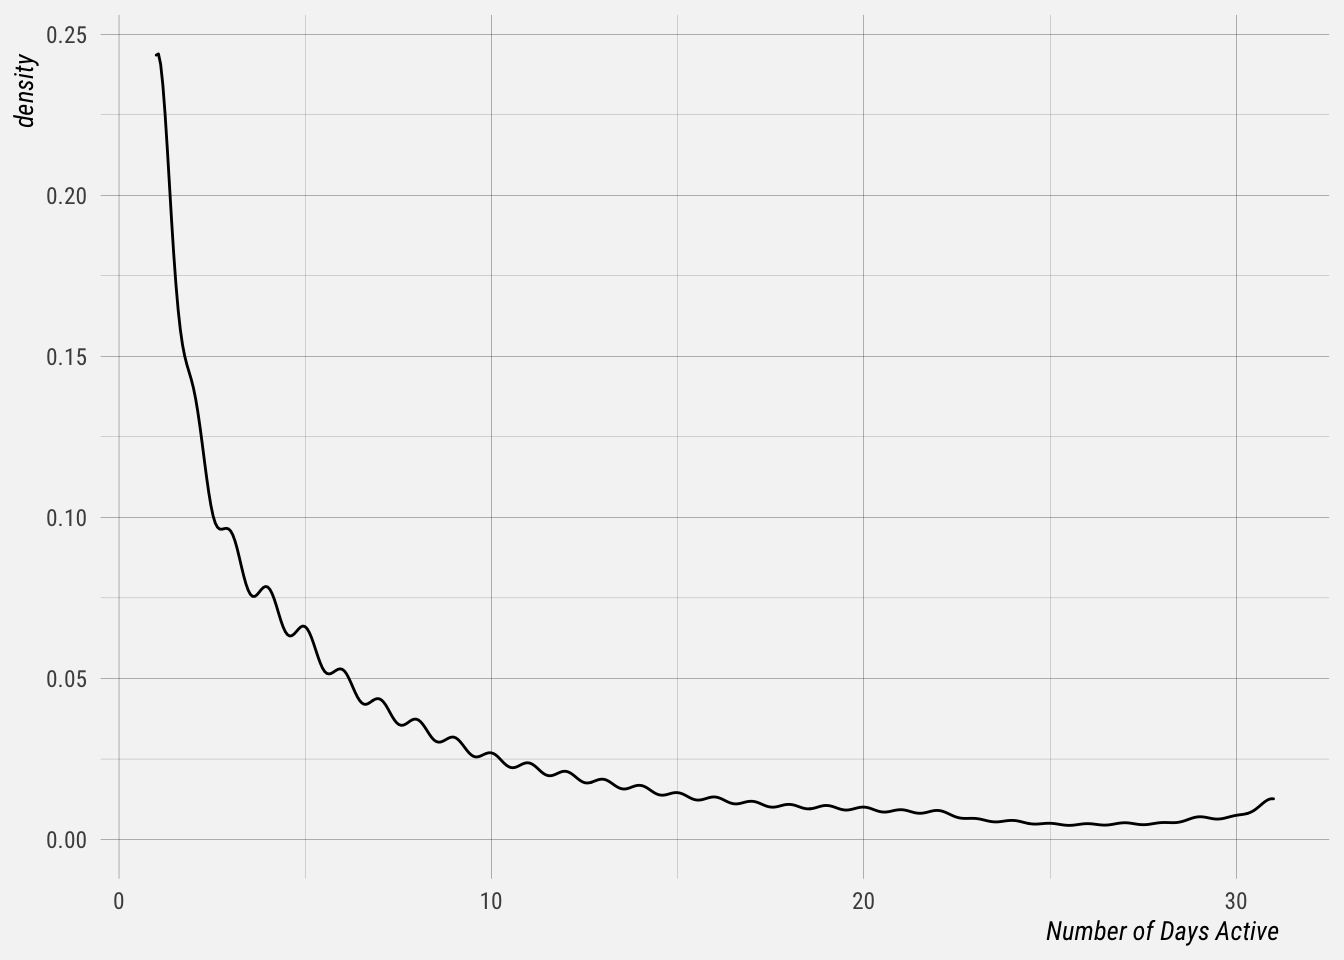
Again a CDF would be more useful to make inferences from the distribution.
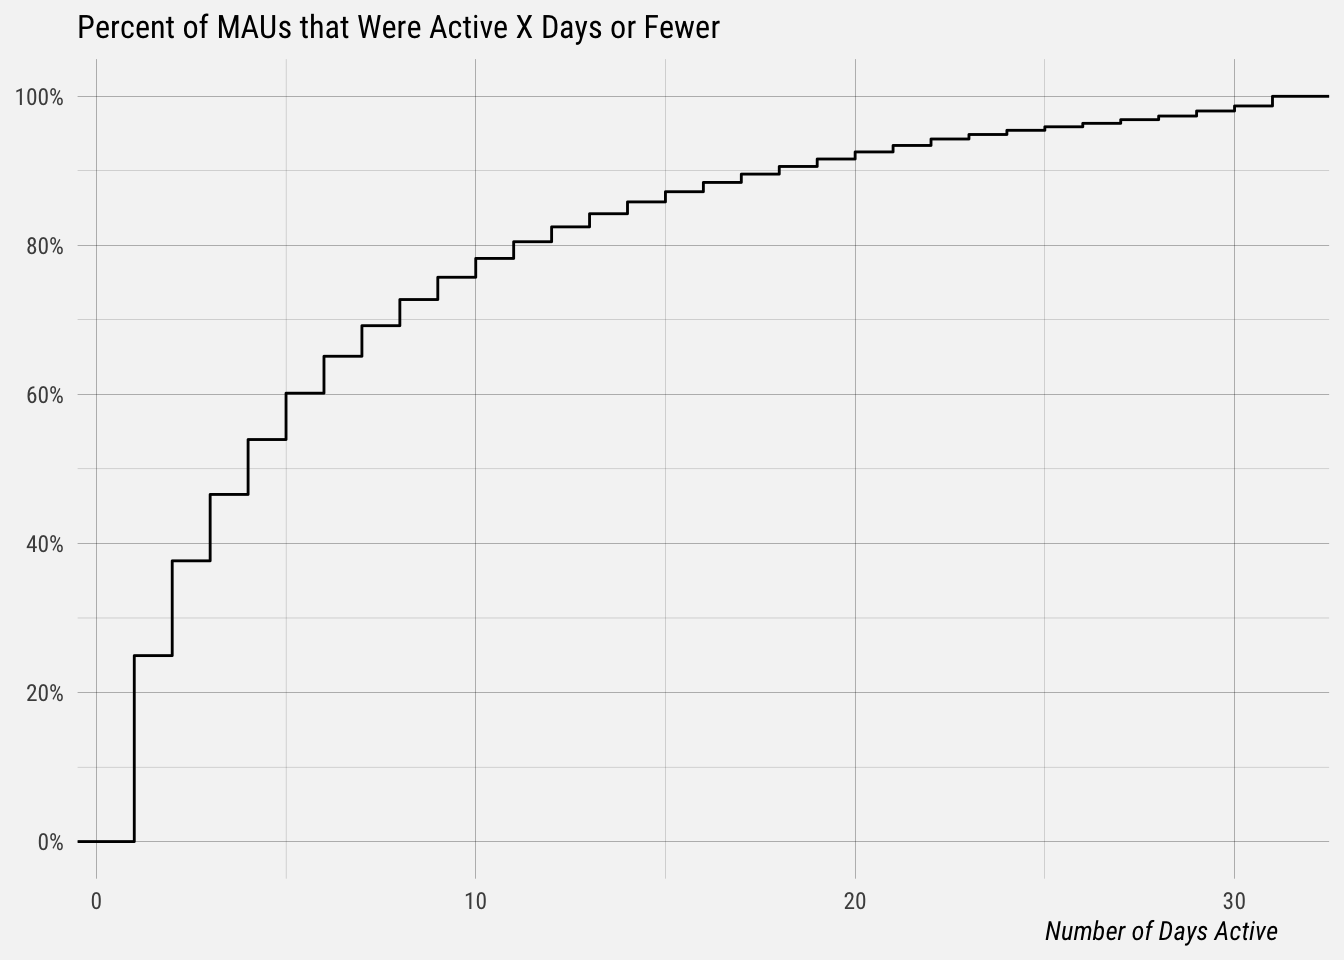
Of Buffer’s MAUs, around 26% were active only one day. Around 60% were active five days or fewer, and around 78% were active 10 days or fewer.
# calculate quantiles
quantile(actions$days_active, na.rm = T)
## 0% 25% 50% 75% 100%
## 1 1 3 8 31Half of MAUs were active 3 days or fewer – the other half were active four or more days. Three quarters of MAUs were active 8 days or fewer (25% were active 9 or more).
Now let’s plot the distribution of the number of weeks users were active.
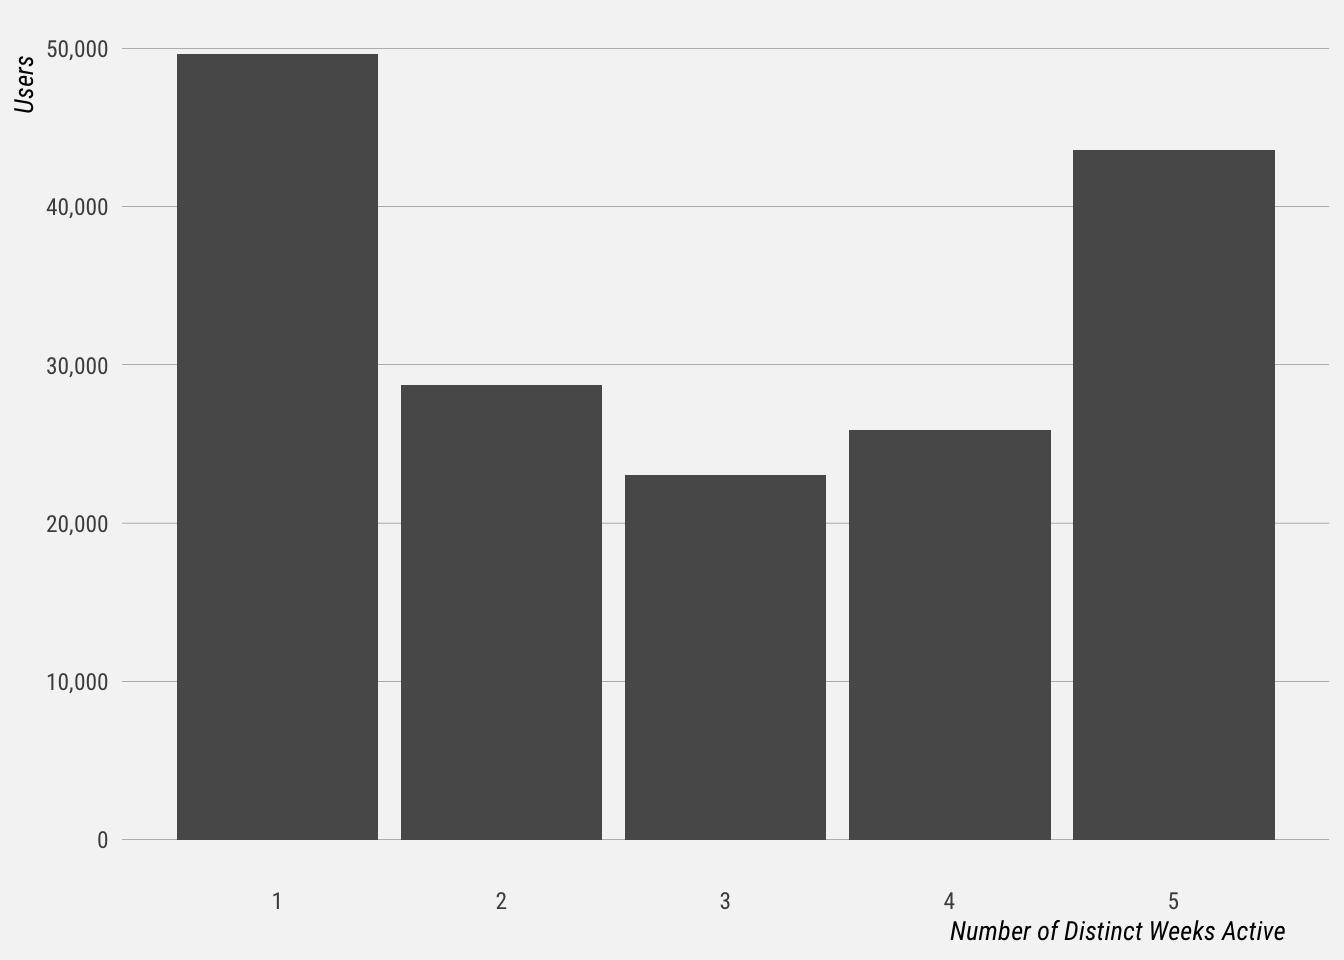
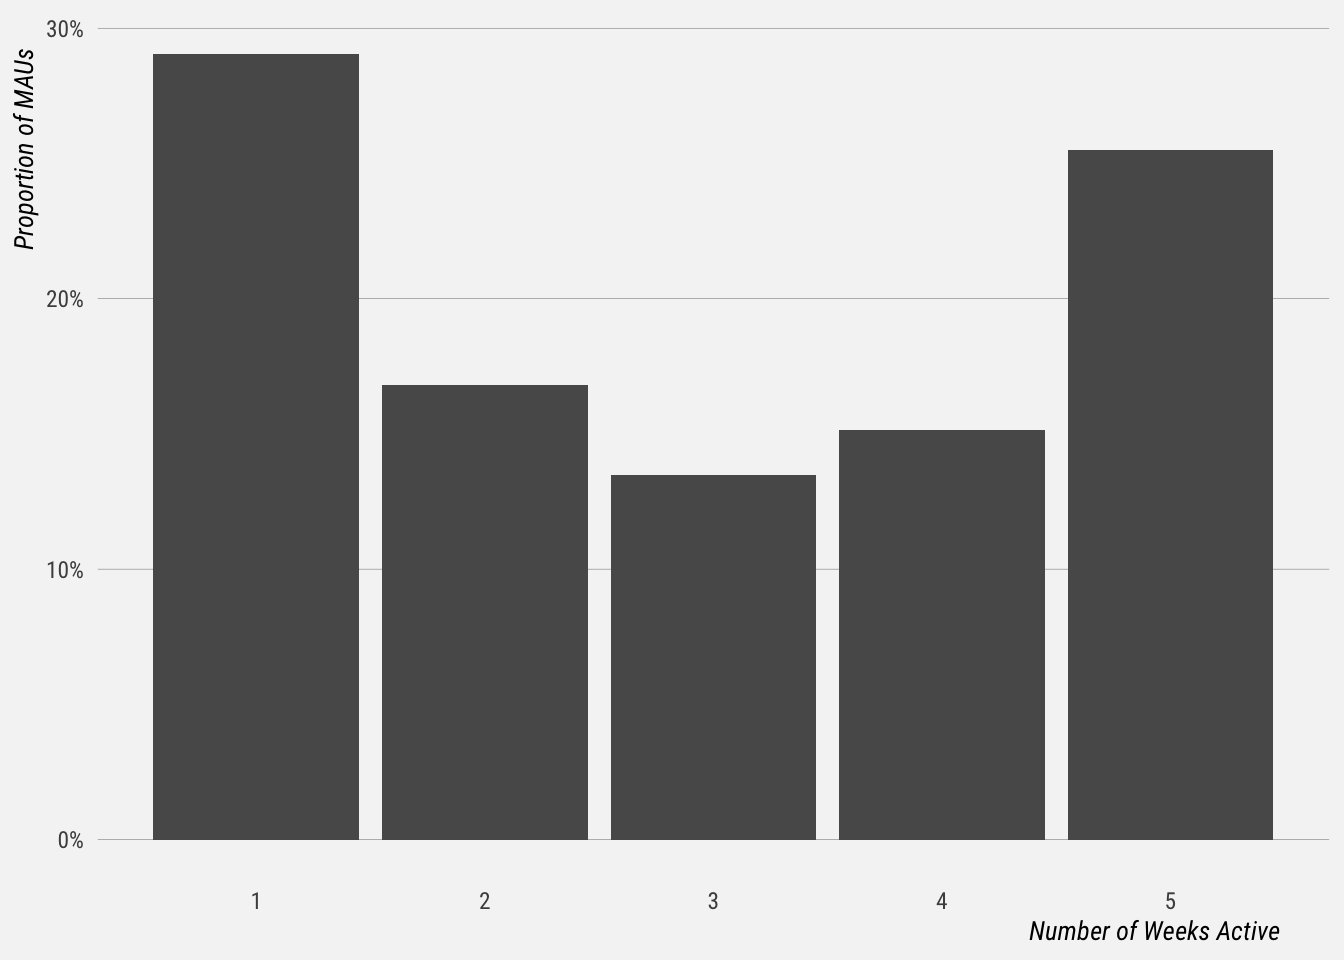
Close to 30% of MAUs were active in only one of the five weeks. Around 17% were active two weeks, 13% three weeks, and 26% were active in all five weeks.
Mobile MAUs
We’ll focus on Publish MAUs for this section of the analysis. In the Post Created event properties, we can see the api client used to create the post – this allows us to see how many were active on mobile devices.
# count publish users by client
actions %>%
  filter(event == "post_created") %>%
  group_by(client_name) %>%
  summarise(users = n_distinct(user_id)) %>%
  arrange(desc(users)) %>%
  mutate(percent = scales::percent(users / sum(users)))
## # A tibble: 5 x 3
## client_name users percent
## <chr> <int> <chr>
## 1 publishWeb 130194 67.2%
## 2 publishIos 31205 16.1%
## 3 publishAndroid 19359 10.0%
## 4 api 12016 6.2%
## 5 <NA> 829 0.4%Now let’s group the client names together and count the number of users active on web only, mobile only, or web + mobile.
# count publish users by client
actions %>%
  filter(event == "post_created" & !is.na(client_name)) %>%
  mutate(client_type = case_when(
    client_name == "publishWeb" | client_name == "api" ~ "Web",
    client_name == "publishIos" | client_name == "publishAndroid" ~ "Mobile"
  )) %>%
  group_by(user_id) %>%
  summarise(web_posts = sum(key_actions[client_type == "Web"]),
            mobile_posts = sum(key_actions[client_type == "Mobile"])) %>%
  mutate(user_type = case_when(
    web_posts > 0 & mobile_posts == 0 ~ "Web Only",
    web_posts == 0 & mobile_posts > 0 ~ "Mobile Only",
    web_posts > 0 & mobile_posts > 0 ~ "Web and Mobile"
  )) %>%
  group_by(user_type) %>%
  summarise(users = n_distinct(user_id)) %>%
  mutate(percent = scales::percent(users / sum(users)))
## # A tibble: 3 x 3
## user_type users percent
## <chr> <int> <chr>
## 1 Mobile Only 28511 17.0%
## 2 Web and Mobile 21253 12.7%
## 3 Web Only 117623 70.3%Of the Publish MAUs, around 70% were exclusively web users, 17% were mobile only users, and 12.7% created posts in mobile and web.
Company Types and Sizes
Next let’s look at the company size and type for Buffer’s MAUs. We only have this information from the target customer survey, which many did not fill out.
# summarize company type
actions %>%
  group_by(company_type) %>%
  summarise(users = n_distinct(user_id)) %>%
  mutate(percent = scales::percent(users / sum(users))) %>%
  arrange(desc(users))
## # A tibble: 11 x 3
## company_type users percent
## <chr> <int> <chr>
## 1 no-answer 37054 21.86%
## 2 <NA> 27946 16.49%
## 3 agency 22410 13.22%
## 4 publisher 18388 10.85%
## 5 personal 16696 9.85%
## 6 online-store 16458 9.71%
## 7 physical-store 10509 6.20%
## 8 b2b 10300 6.08%
## 9 saas 4784 2.82%
## 10 none 2619 1.55%
## 11 government-entity-public-sector 2328 1.37%Somewhat surprisingly, the most common company type of those MAUs that filled in the target customer survey are agencies. Next let’s look at company sizes.
# summarize company size
actions %>%
  group_by(company_size) %>%
  summarise(users = n_distinct(user_id)) %>%
  mutate(percent = scales::percent(users / sum(users))) %>%
  arrange(desc(users))
## # A tibble: 7 x 3
## company_size users percent
## <chr> <int> <chr>
## 1 less-than-5 63443 37.4%
## 2 5-to-50 30303 17.9%
## 3 <NA> 27946 16.5%
## 4 no-answer 23150 13.7%
## 5 na 12986 7.7%
## 6 51-to-500 8305 4.9%
## 7 more-than-500 3346 2.0%Most MAUs, around 37%, are part of organizations that consist of five or fewer people.
Paying MAUs
Lets quickly look at how many Publish MAUs are currently on a paid plan.
# count publish MAUs on paid plans
actions %>%
  filter(event == "post_created" & !is.na(billing_plan)) %>%
  mutate(is_paid = case_when(
    billing_plan == "individual" ~ "Free",
    !is.na(billing_plan) & billing_plan != "individual" ~ "Paid"
  )) %>%
  group_by(is_paid) %>%
  summarise(users = n_distinct(user_id)) %>%
  mutate(percent = scales::percent(users / sum(users)))
## # A tibble: 2 x 3
## is_paid users percent
## <chr> <int> <chr>
## 1 Free 123211 75%
## 2 Paid 41962 25%Around 25% of Publish MAUs are currently on paid plan. But how many MAUs have paid us at some point in their lifetime using Buffer?
## # A tibble: 2 x 3
##   paid_ever           users percent
##   <chr>               <int> <chr>
## 1 Never Paid         120102 71%
## 2 Paid At Some Point  49267 29%
Around 29% of monthly active users paid at some point. Next let’s look at trials.
MAUs and Trials
First let’s plot the number of trials that Buffer’s MAUs have been on at any point. We’ll use the dbt_buffer.stripe_trials to count the number of Stripe events in which a subscription was created with a status of trialing for these users.
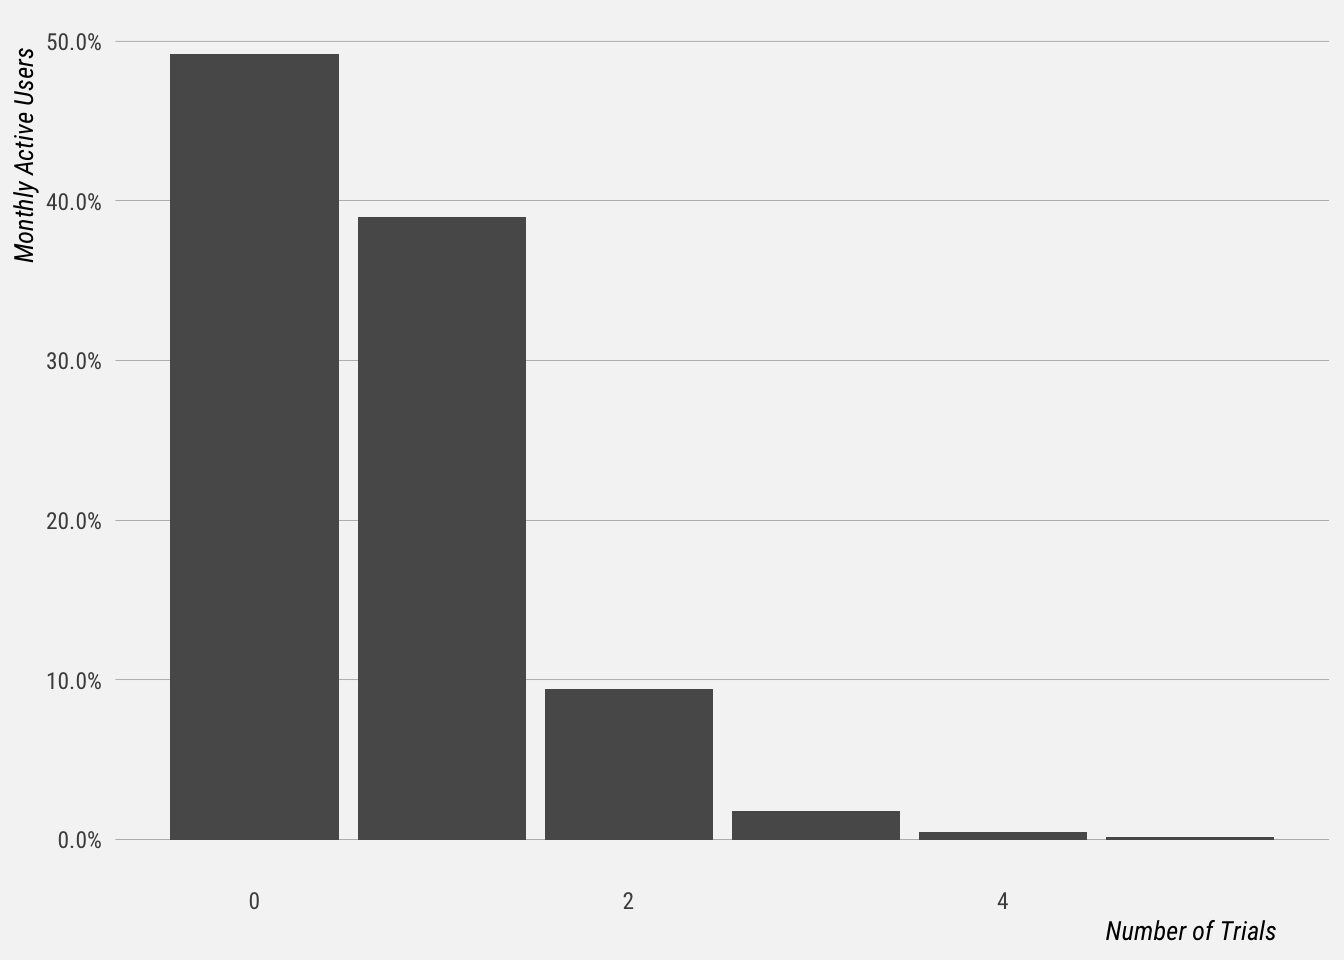
Interestingly, most monthly active users haven’t been on a Stripe trial. This may be because most signed up for Buffer before we put all new users onto trials. It may also suggest that there are a lot of users that signed up on mobile (Buffer doesn’t put new mobile users onto trials).
Conclusions
Buffer’s monthly active users are made up mostly of Publish users. There is a mix of paying customers and free users, with around 25% of MAUs currently paying for a Publish subscription.
There is also a mix of new and old users. More than half of MAUs created accounts over a year and a half ago. This differs for each product – Analyze users tend to be younger and Engage users skew older.
Almost 30% of MAUs were active in only one week of the month. Around 17% were active two weeks, 13% three weeks, and 26% were active in all five weeks. A quarter were only active on one day of the month and 50% were active three days or fewer.
Of the Publish MAUs, around 70% were exclusively web users, 17% were mobile-only users, and 12.7% created posts on mobile and web.
Of MAUs that filled out the target customer survey, most were agencies or publishers, and the vast majority had five or fewer team members in the organization.
Somewhat surprisingly, almost half of all MAUs haven’t been on a trial. Over 10% have been on multiple trials.