On Monday January 25 the engagement tool was launched to the public. In this analysis we’ll try to estimate the impact that this launch has had on trial conversions. The dataset includes approximately 45 thousand trials started between January 1, 2021 and February 1, 2021.
Key Findings
Users that use the engagement tool are much more likely to convert to paid subscriptions than users that don’t, controlling for activity.
The overall conversion rate remains relatively stable, which suggests that trialists that were already more likely to convert are making use of the tool.
The effect of the engagement launch is likely confounded by the re-launch of the free plan a few days before.
In the future, the gold standard for estimating the effect would be to run a randomized experiment in which a random proportion of people are given access to the feature. The trial conversion rates of those with and without access could then be directly compared.
Summary Statistics
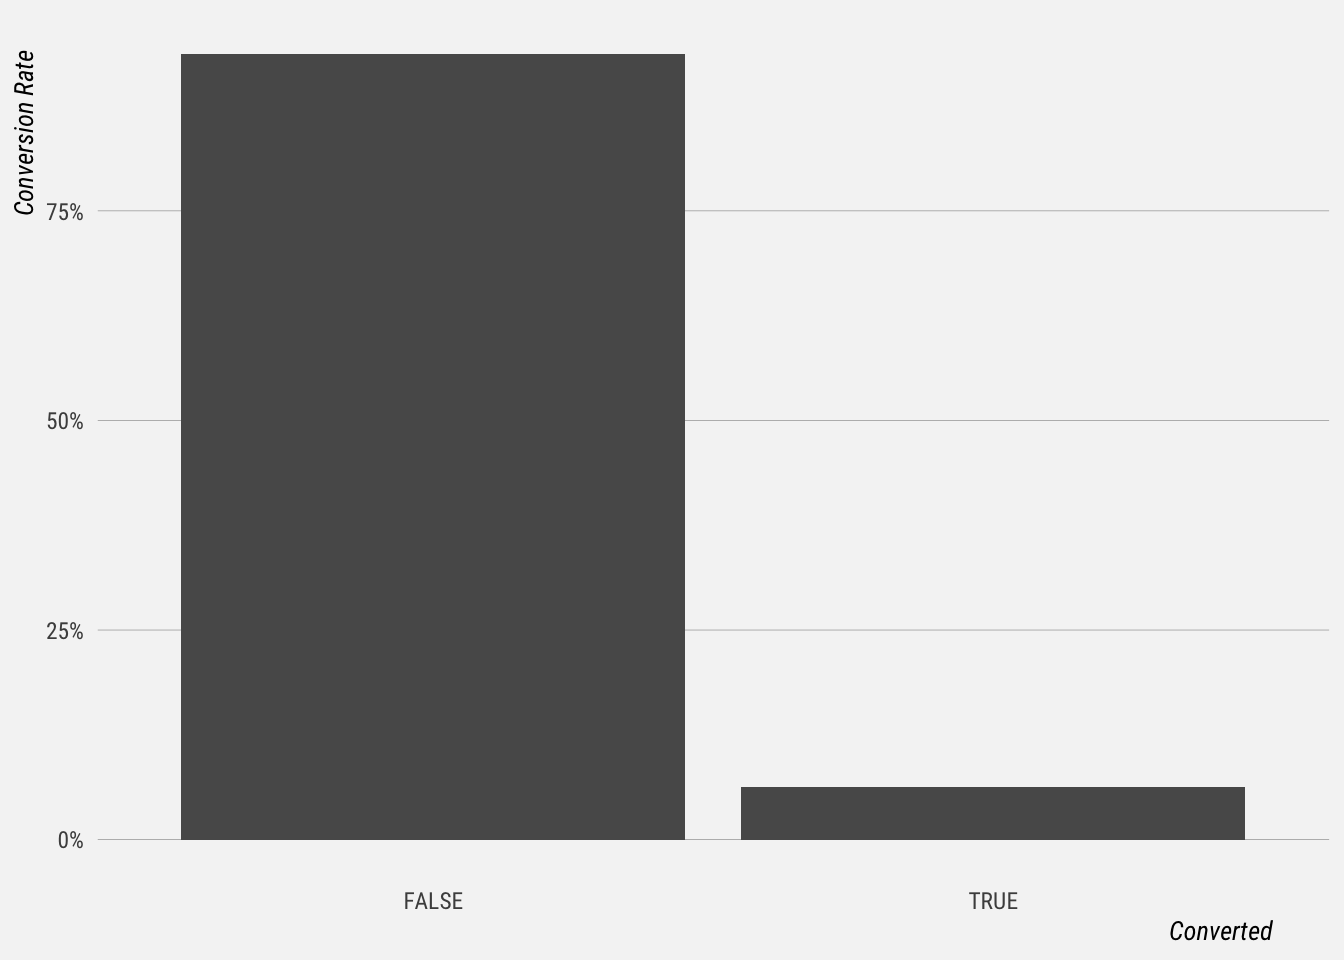
To begin, let’s get a better sense of the dataset with some summary tables. The table below shows the total number and percentage of trials that converted to a paid subscription.
Next we’ll create a similar summary table, but include the use of the engagement tool as an additional factor to segment the trials by.
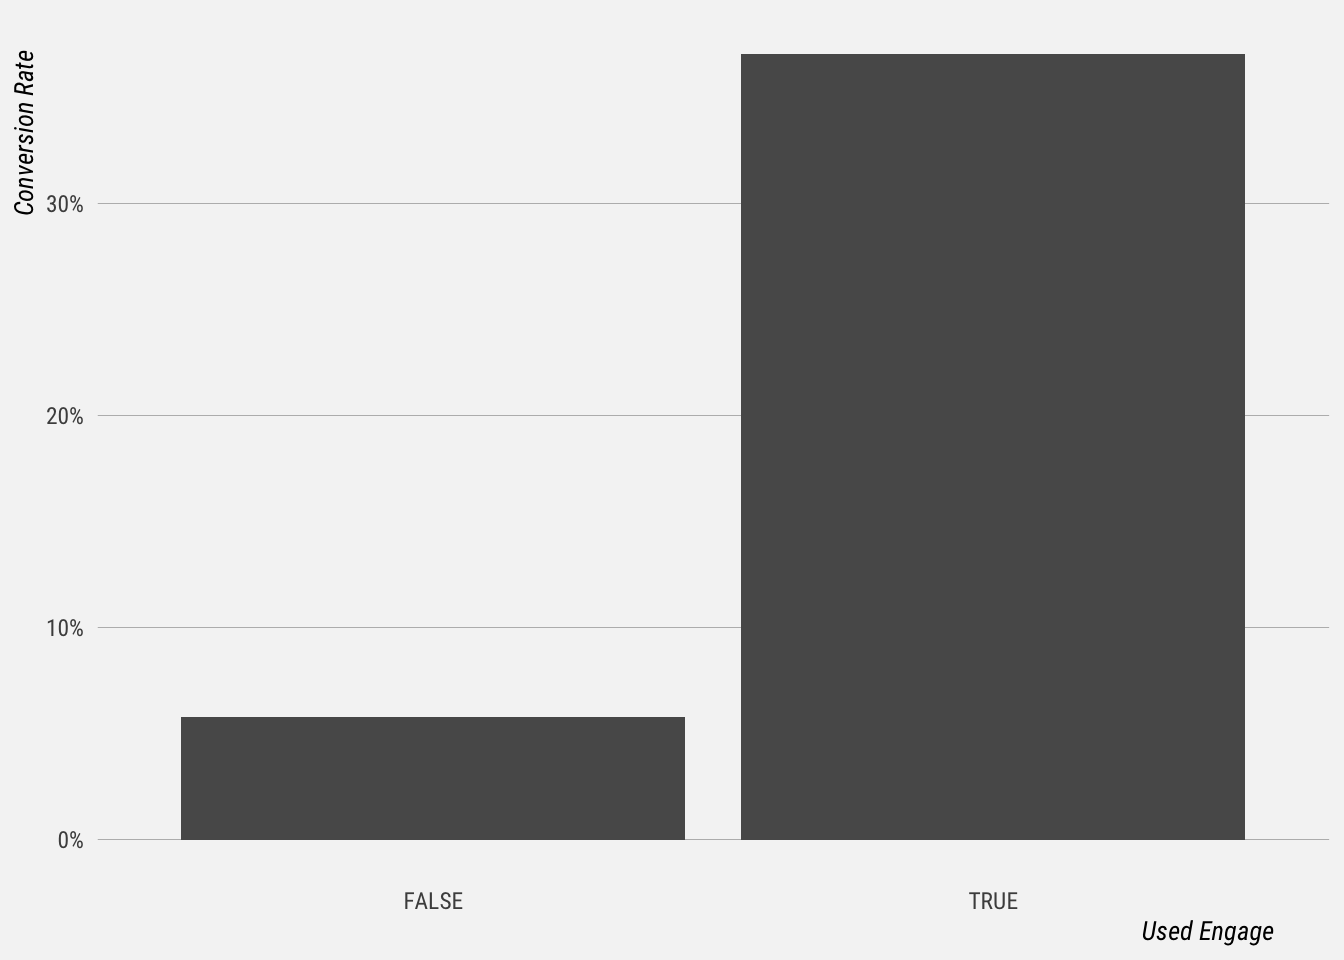
The table shows that users that used the engagement tool converted at a much higher rate (37%) than those that did not (6%).
Controlling for Activity
One thing we need to be careful of is inadvertently comparing active trialists to inactive trialists. We will attempt to control for activity by only looking at trialists that connected an Instagram Business account and took at least one key action during the trial. The idea is that, by excluding inactive trials, we get closer to isolating the effect that using Engage has on trial conversion.
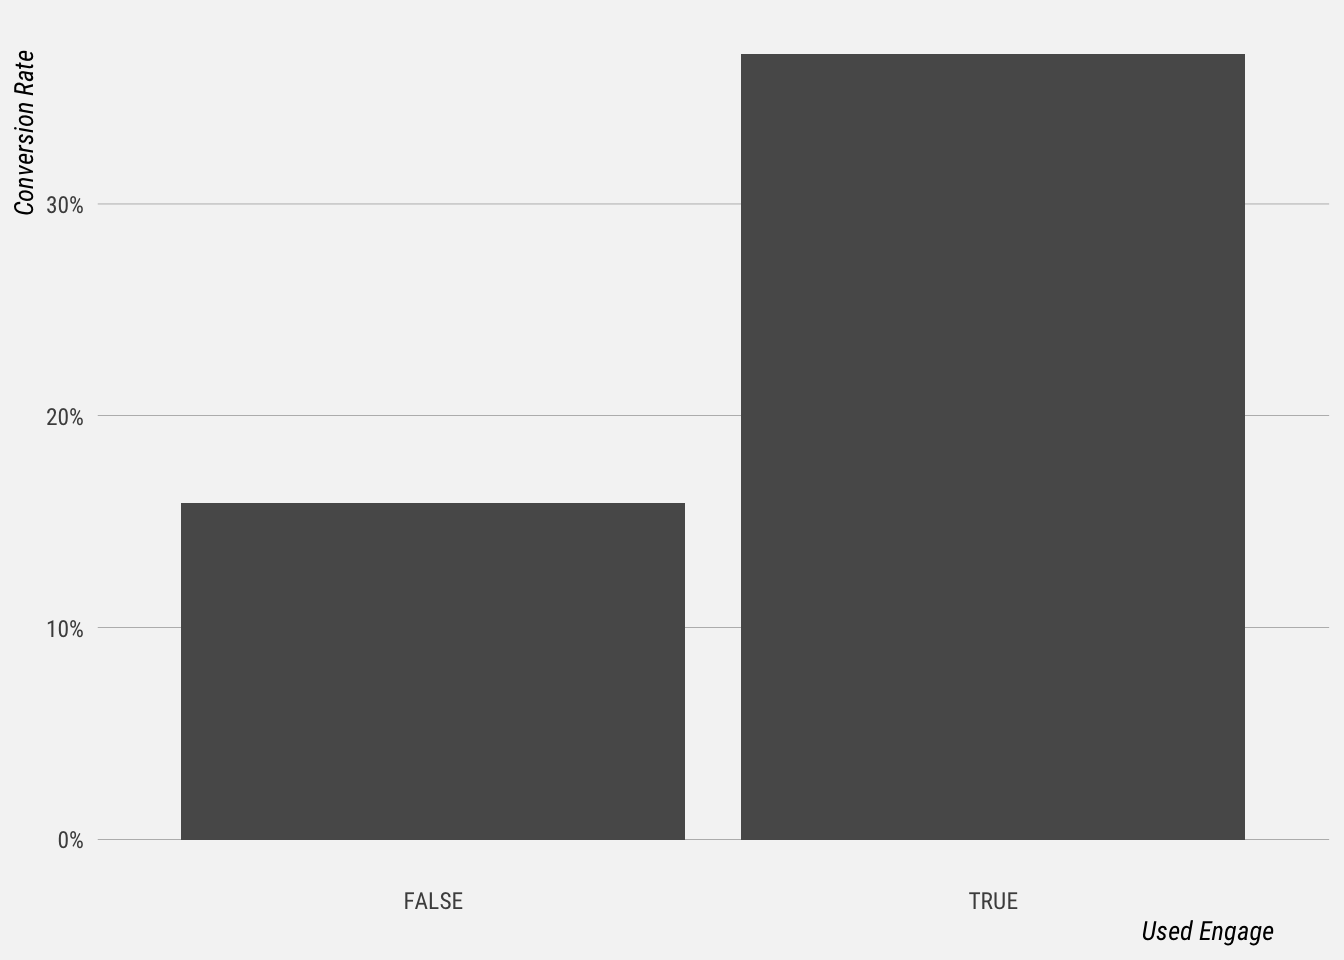
This table shows us that users that used the engagement tool during their trial still converted at significantly higher rates than those that did not, even if we only look at active trialists.
General Linear Model
We can also fit a logistic regression model to this data to estimate the effect that using the engagement tool has on the likelihood of conversion, controlling for all other factors.
The other factors that we’ll be controlling for are the number of days active during the trial, whether the user connected an Instagram Business account, and whether the user was active in Publish and Analyze.
It should be noted that some of these factors are correlated, which makes the estimation of coefficient size more complicated and less reliable.
# create new fields
trials <- trials %>%
  mutate(used_publish = publish_actions >= 1,
         used_analyze = analyze_actions >= 1,
         used_engage = engage_actions >= 1,
         has_ig = profiles_added >= 1)

# fit logistic regression model
mod <- glm(converted ~ key_action_dates + has_ig + used_publish +
             used_analyze + used_engage, family = "binomial", data = trials)

# sumamrise model
summary(mod)
##
## Call:
## glm(formula = converted ~ key_action_dates + has_ig + used_publish +
## used_analyze + used_engage, family = "binomial", data = trials)
##
## Deviance Residuals:
## Min 1Q Median 3Q Max
## -1.7841 -0.3191 -0.1462 -0.1462 3.0144
##
## Coefficients:
## Estimate Std. Error z value Pr(>|z|)
## (Intercept) -4.532612 0.051816 -87.475 < 2e-16 ***
## key_action_dates 0.113687 0.006311 18.015 < 2e-16 ***
## has_igTRUE 1.193038 0.050886 23.445 < 2e-16 ***
## used_publishTRUE 1.126125 0.059218 19.017 < 2e-16 ***
## used_analyzeTRUE 1.031847 0.052622 19.609 < 2e-16 ***
## used_engageTRUE 0.840179 0.103424 8.124 4.52e-16 ***
## ---
## Signif. codes: 0 '***' 0.001 '**' 0.01 '*' 0.05 '.' 0.1 ' ' 1
##
## (Dispersion parameter for binomial family taken to be 1)
##
## Null deviance: 20823 on 44462 degrees of freedom
## Residual deviance: 16775 on 44457 degrees of freedom
## AIC: 16787
##
## Number of Fisher Scoring iterations: 6It turns out that these are all significant predictors of converting! Of the five predictors included in the model, having an Instagram Business account connected has the largest coefficient, which makes intuitive sense.
Conversion Rates Over Time
So far we’ve seen that using the engagement tool is a good indicator of success. However it very well may be the case that active users that were already likely to convert are using the engagement tool. People with Instagram Business accounts with sufficiently high follower counts – already the most likely to convert – potentially get the most benefit from the engagement tool.
Since we did not run a randomized experiement, it’s difficult to tell if the engagement tool causes an increased likelihood of converting. Let’s do a quick gut check and plot the trial conversion rate over time.
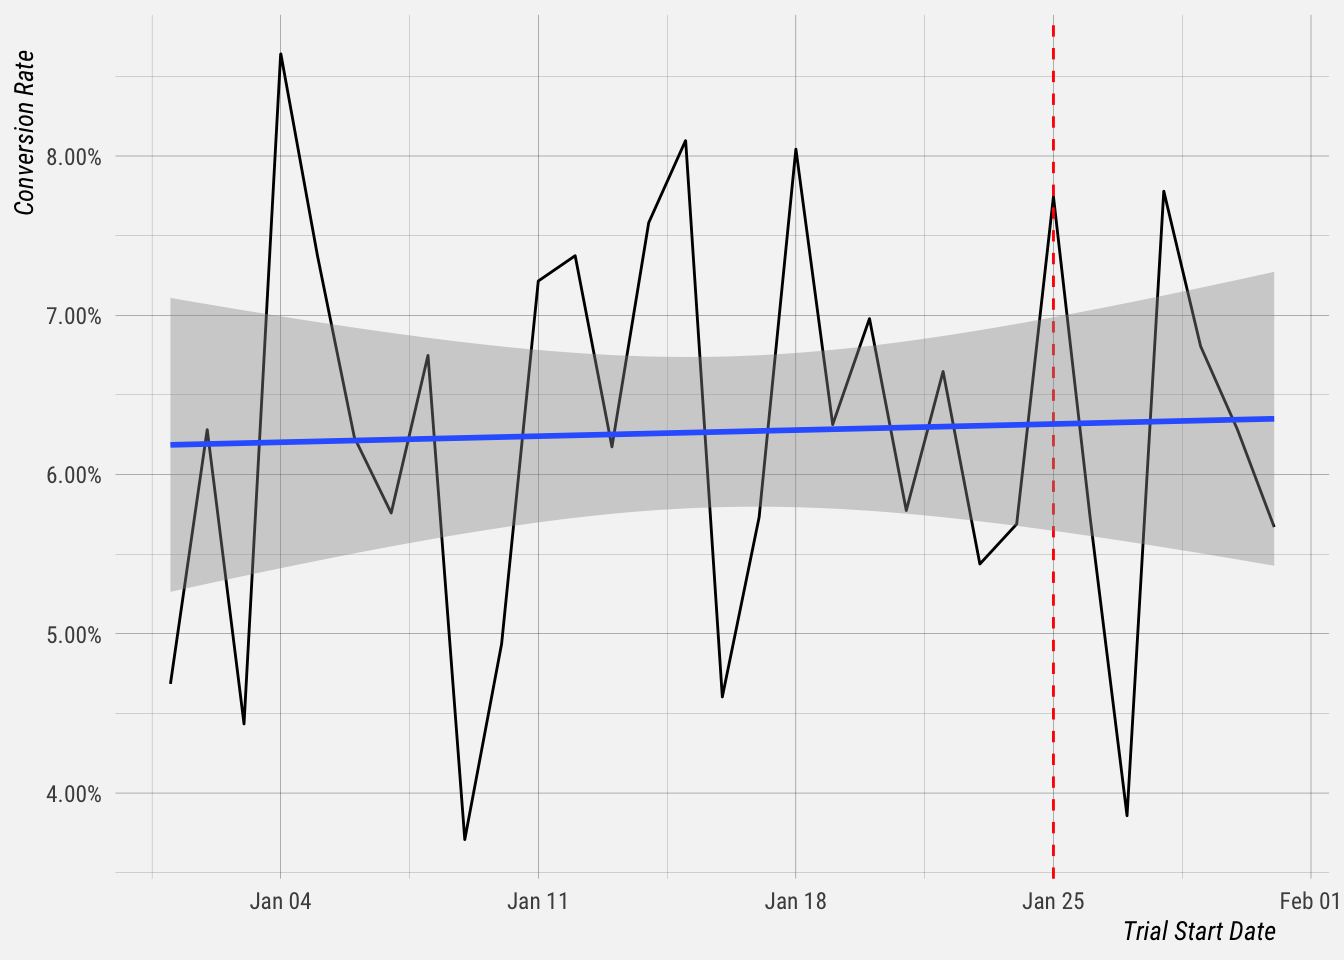
The dotted red line indicates the launch date of the engagement tool. Just by eyeballing this plot it seems clear that we can’t yet say that the launch of the engagement tool has caused an increase in trial conversion rates.