Welcome to the first edition of our monthly data team digests for 2019!
This year the Buffer data team has resolved to try something new. Each month, we’re hoping to curate a summary of all that’s happening in the data team. A place to share the analysis we’ve recently done, new insights or observations, interesting graphs and updates on what we’re working at the moment.
This is our first edition, hope you enjoy reading it. Feedback, questions and comments are welcome!
Data blog
We have a new data blog at data.buffer.com! The goal of our blog to share some of the interesting or useful analysis, findings and learnings as a result of the work we do.
We’re planning on sharing all of this with the Buffer team and transparently to other folks that that might be interested. We’ve also decided to share our monthly digests in the open on this blog, so that’s where you’re reading the first edition right now!
Looker Dashboards
There are a quite a few interesting Looker dashboards that you might not be aware of. We’d love to share some of these with the whole Buffer team, it’s always great to have a view of areas of the company you might not be involved with daily and learn about the metrics each team cares about.
These dashboards will only be available to Buffer team members (shout if you have any trouble accessing them!), but we’ve also included screenshots for the curious.
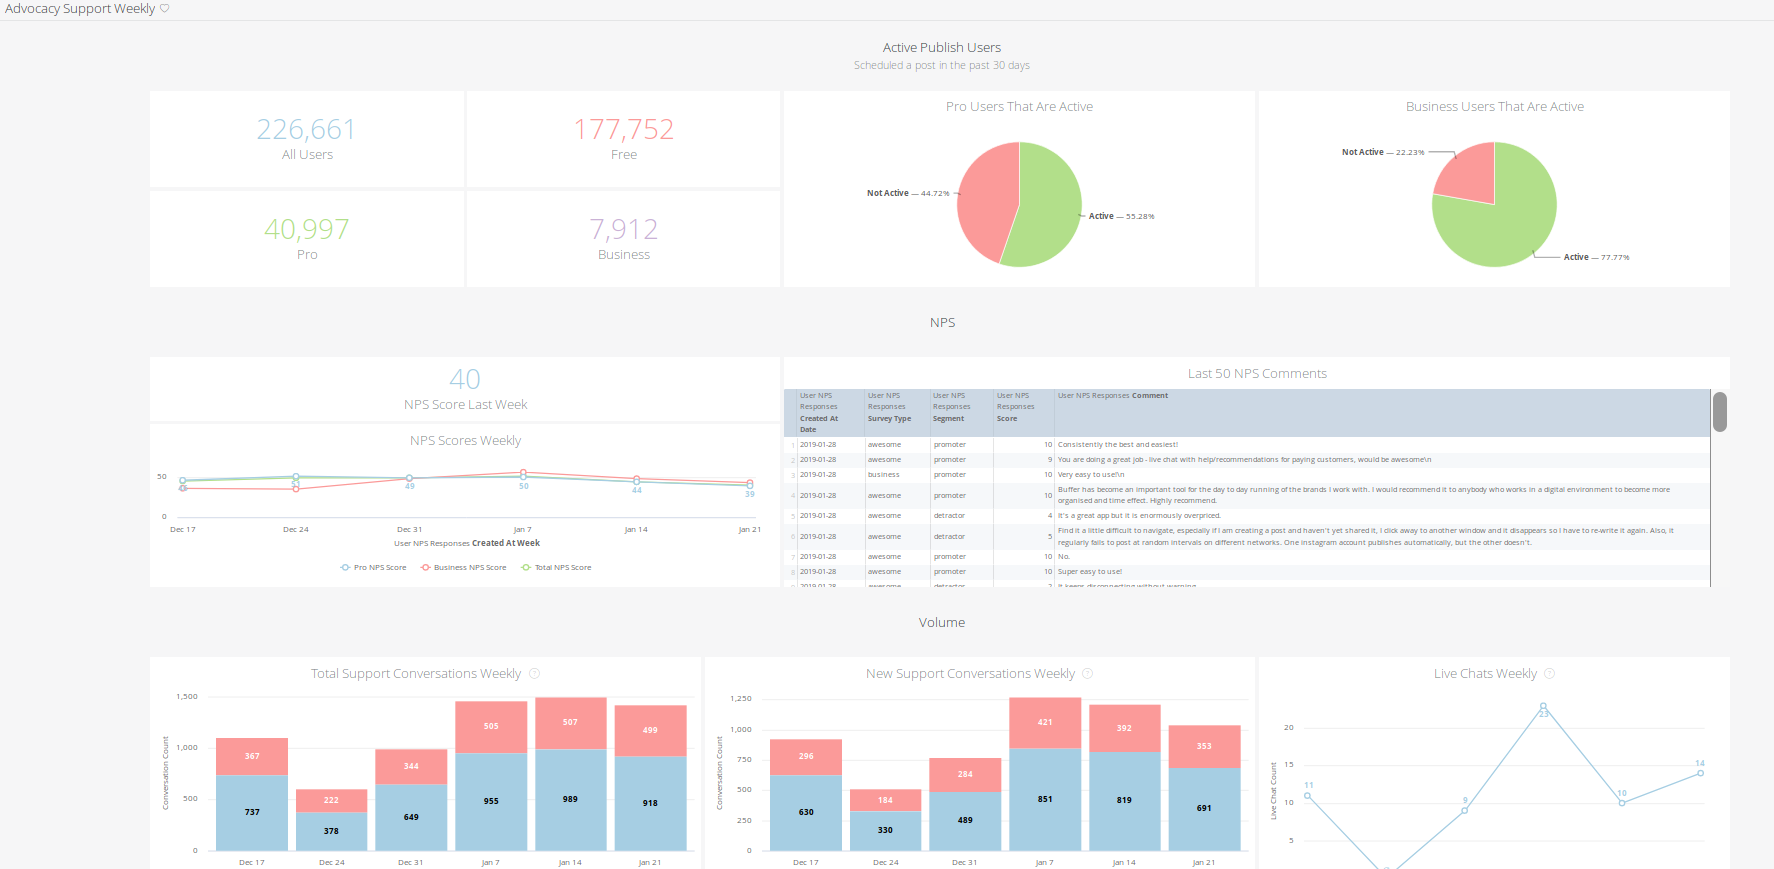
Advocacy weekly support dashboard
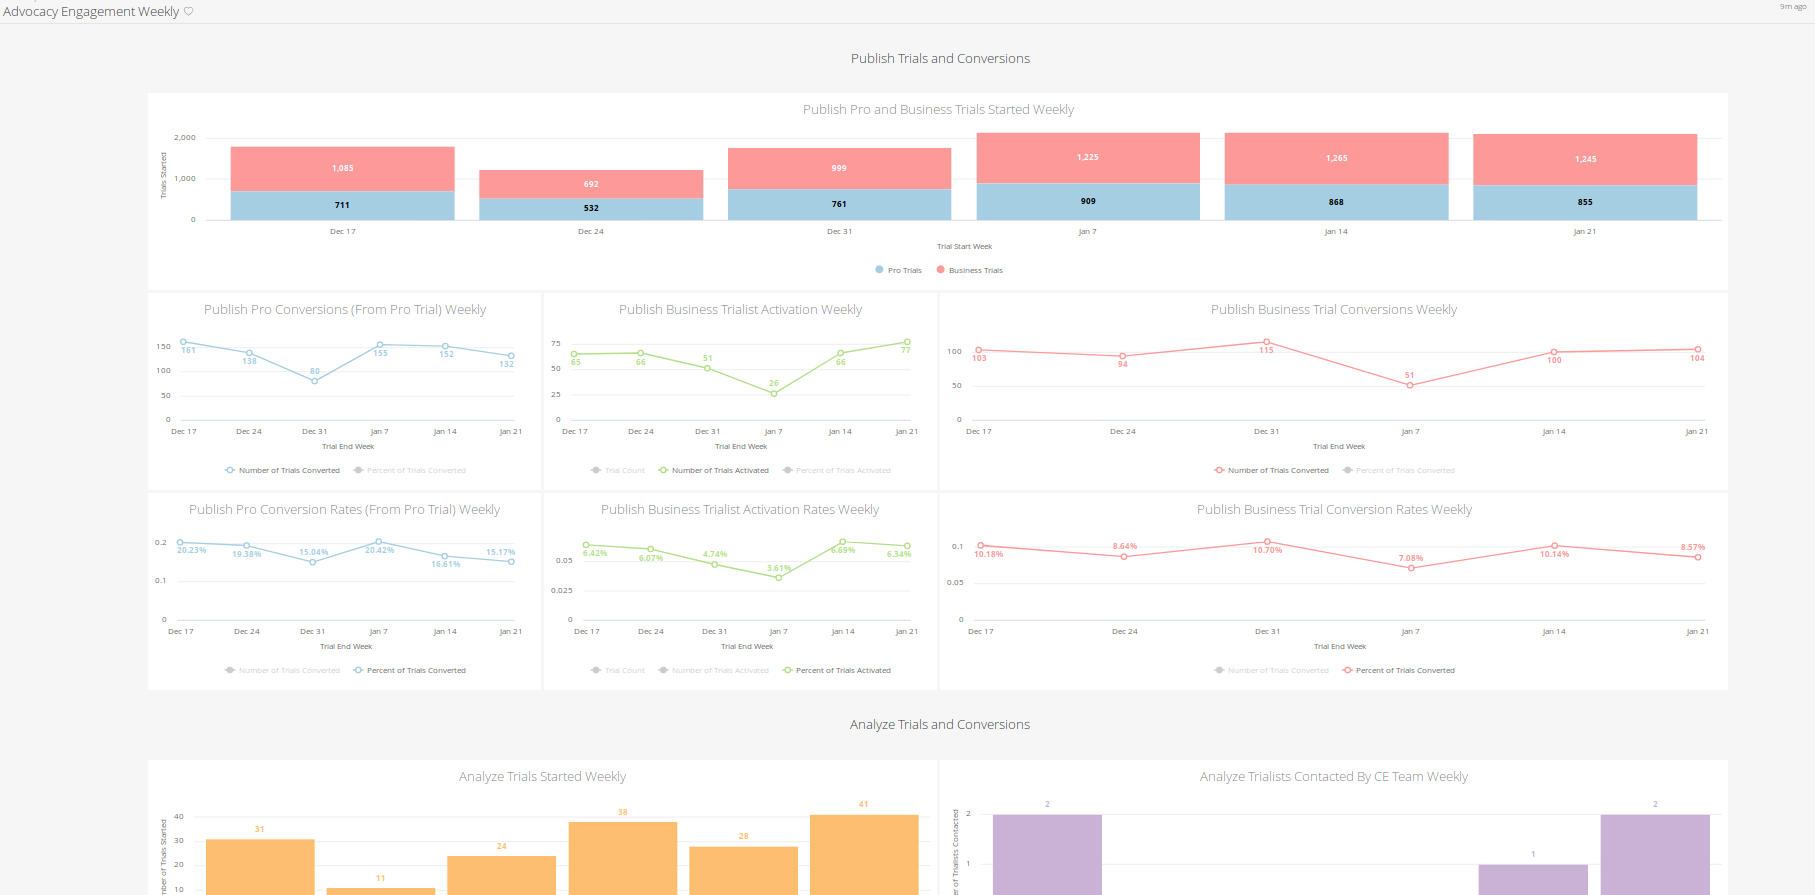
Advocacy engagement weekly dashboard
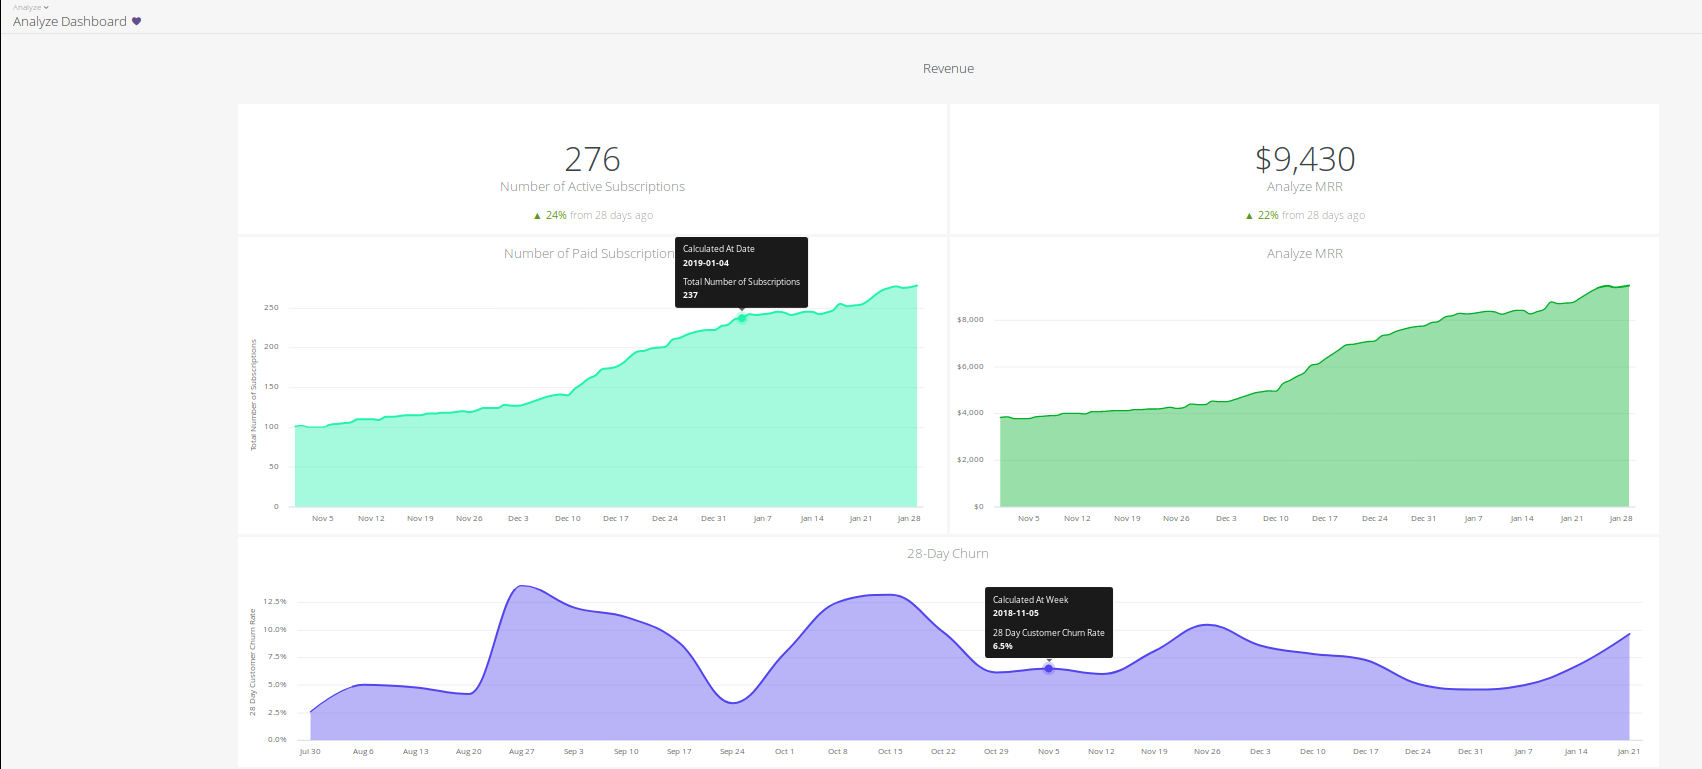
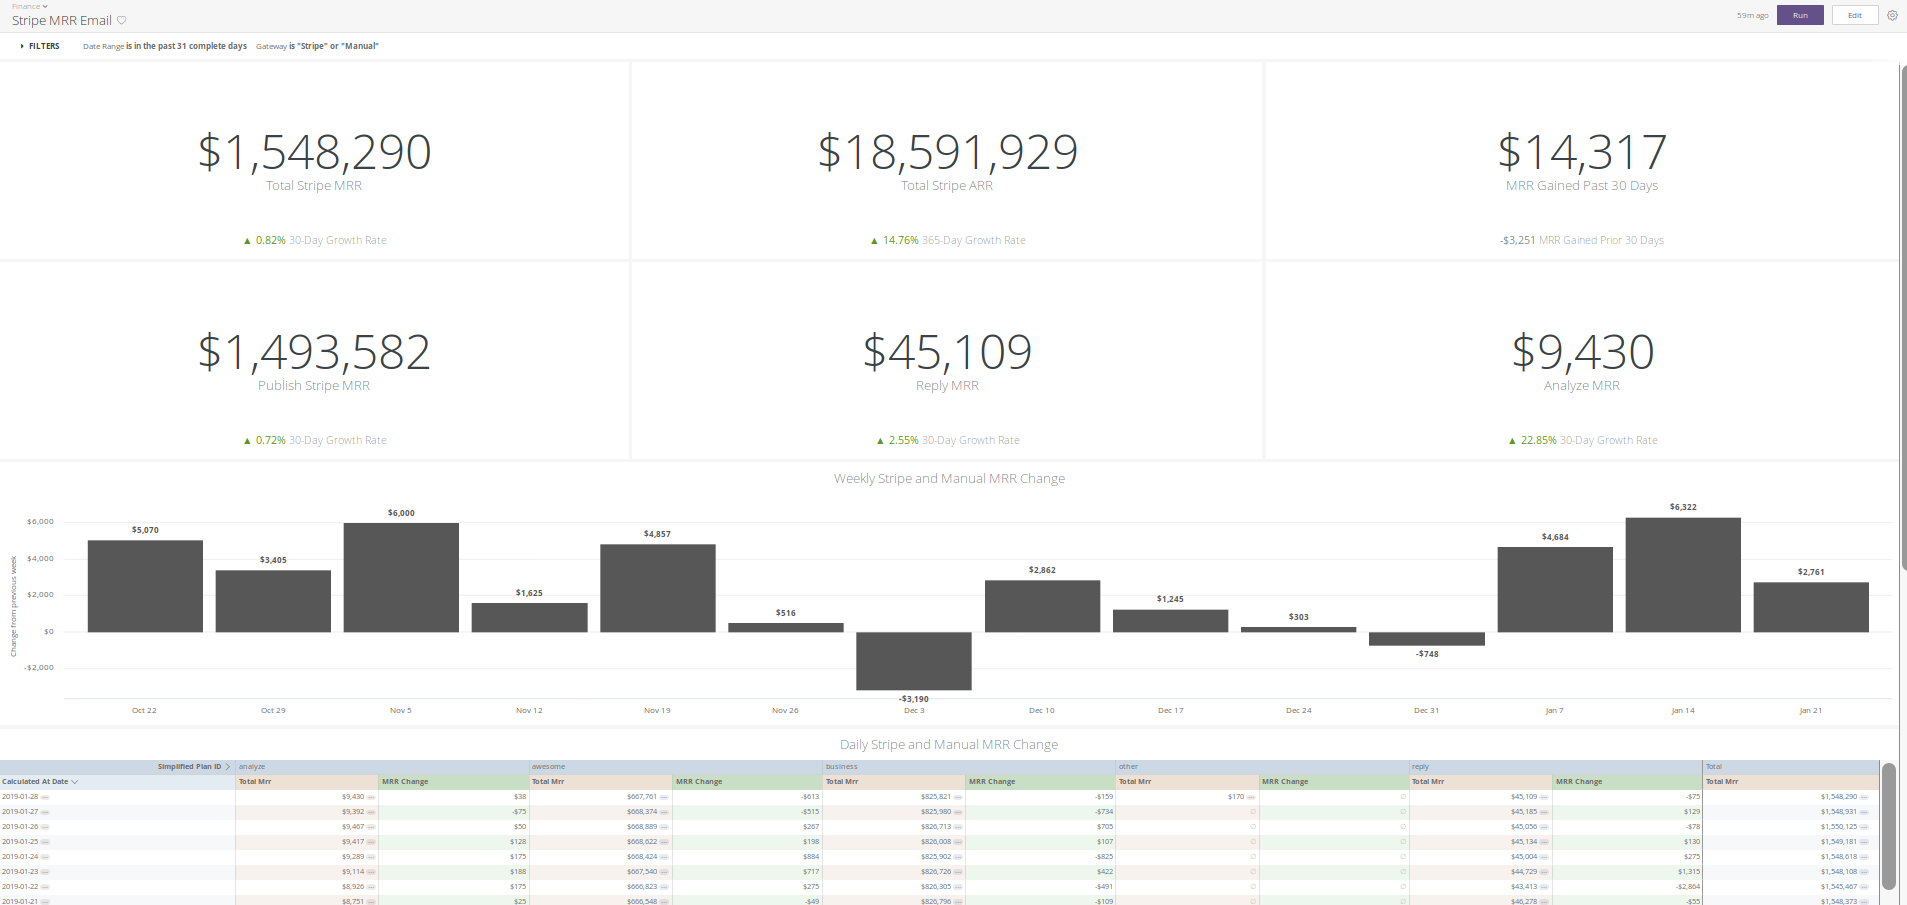
Buffer Revenue Goals
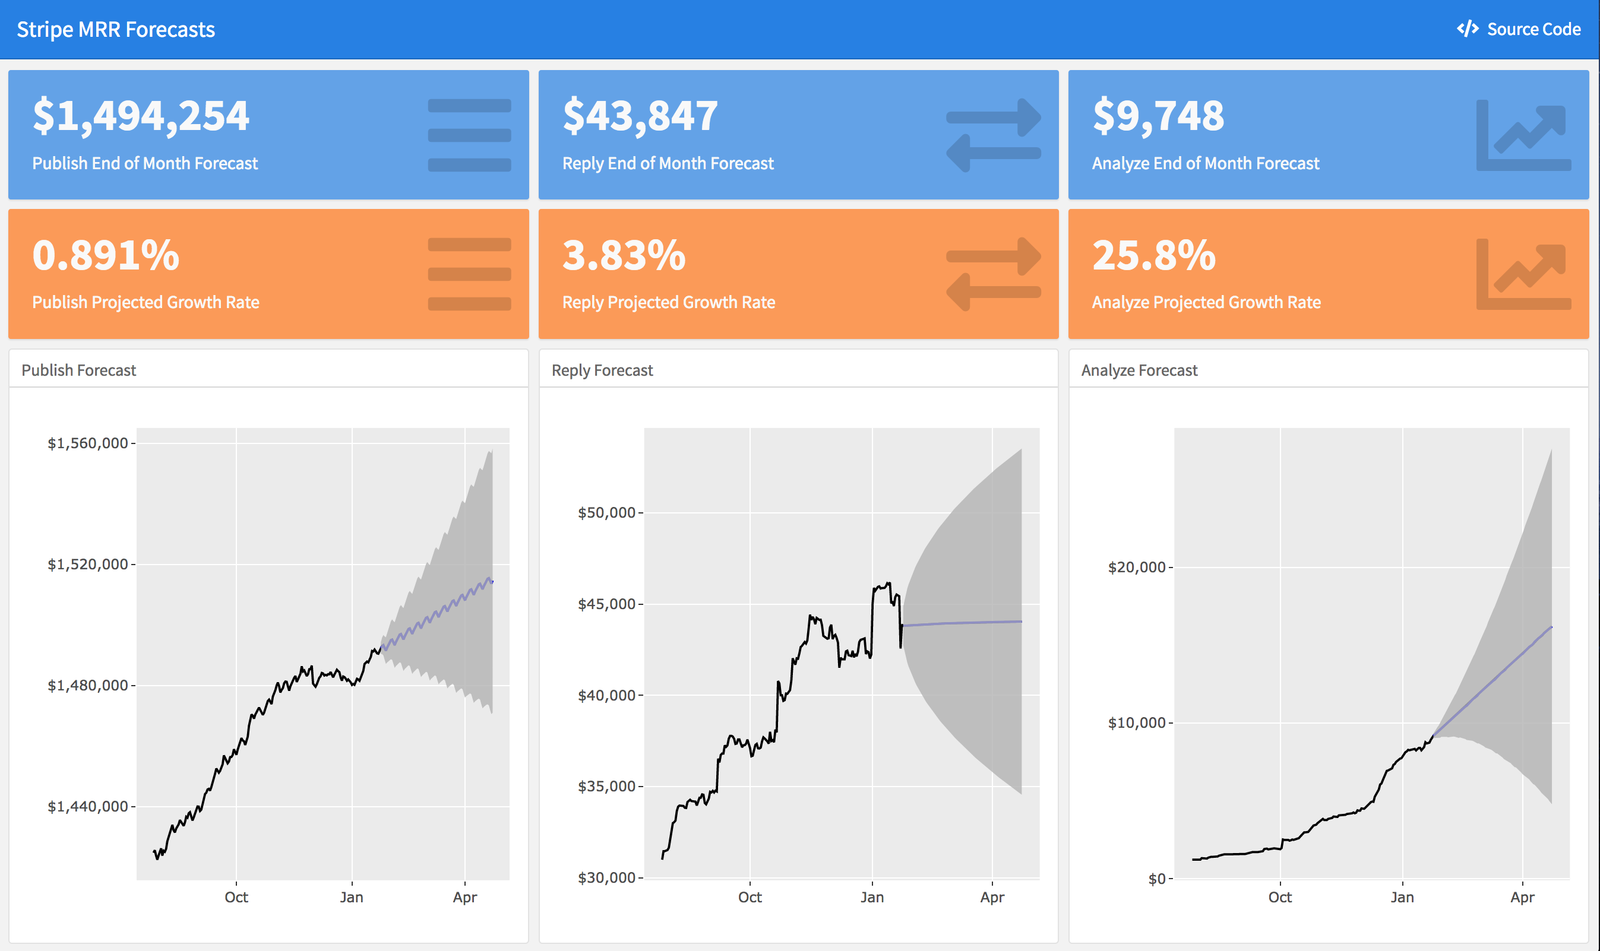
We thought we might check in with our revenue goals as laid out in this spreadsheet. How are we currently doing? What are our projections for the near future?
Publish: 1.00%
- Projected growth rate: 0.9%.
Reply: 6%
- Projected growth rate: 2.9%
Analyze 45%
- Projected growth rate: 25.4%
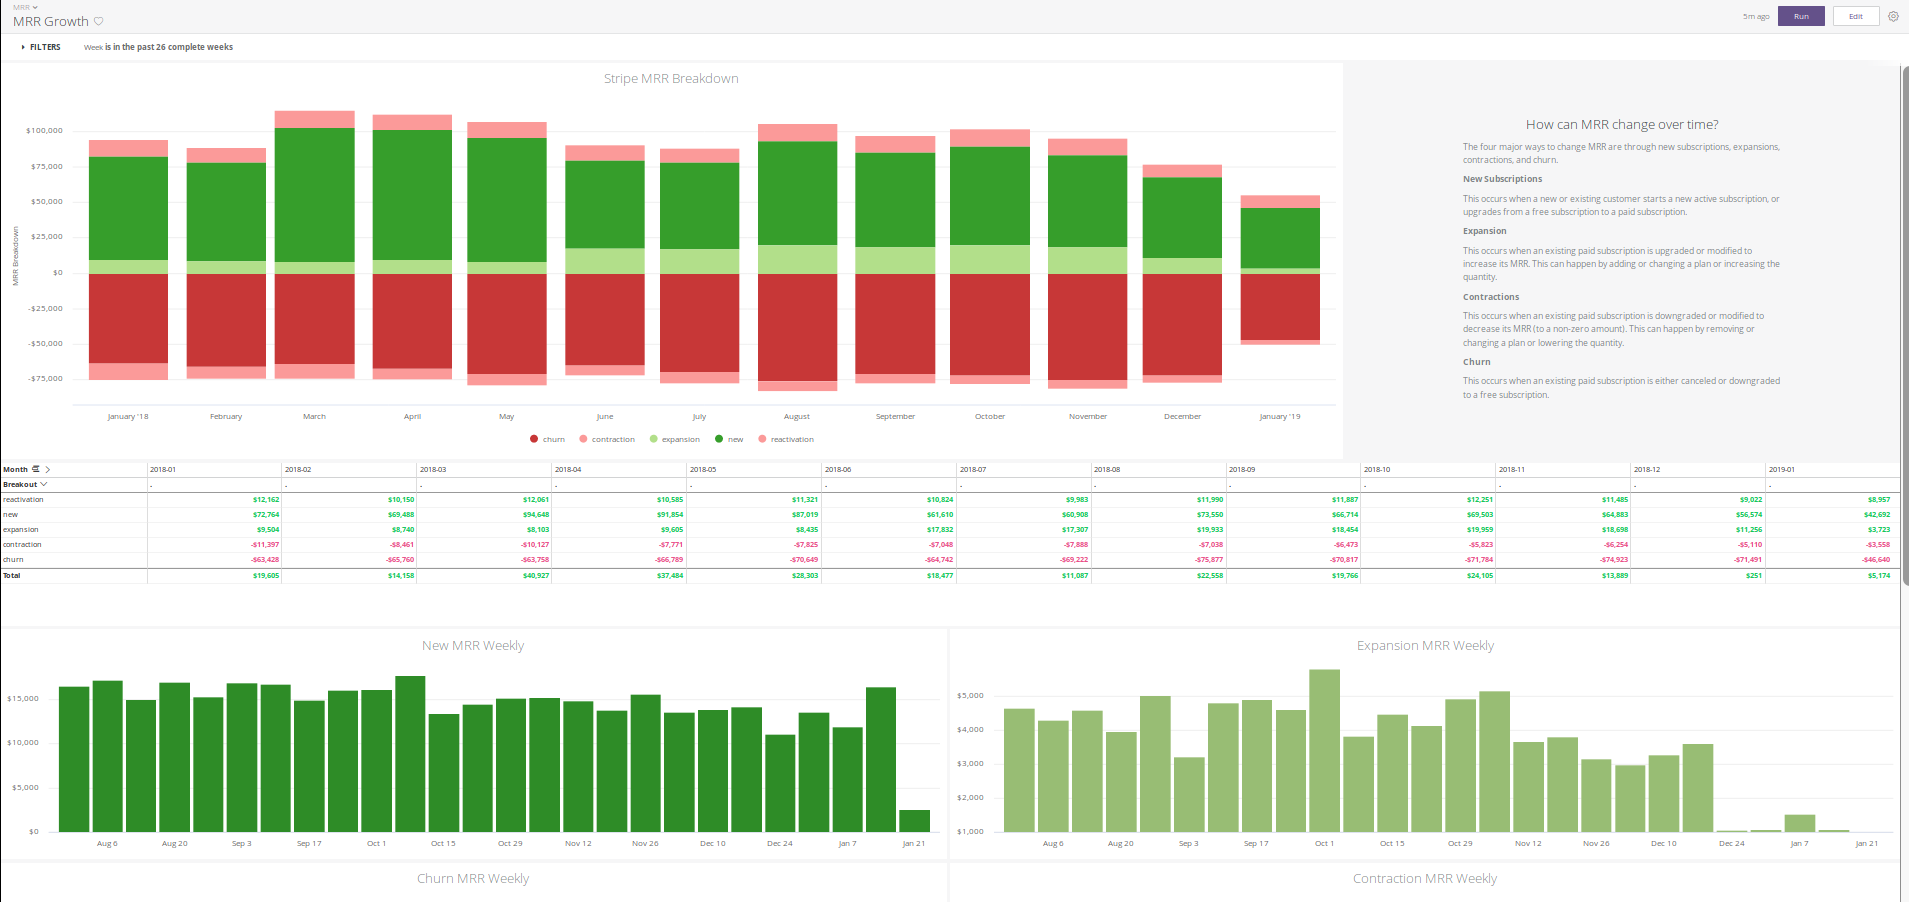
A while ago, the data team put together a little app you can use to view monthly growth projections. You can see it at mrr.buffer.com.
It uses an exponential smoothing algorithm to make the forecasts and uses historical data from the past 180 days. It gives the most weight to the growth rates in the very recent past, but still gives some weight to growth trends that occurred over a longer time span.
Exponential smoothing is a rule of thumb technique for smoothing time series data using the exponential window function. Whereas in the simple moving average the past observations are weighted equally, exponential functions are used to assign exponentially decreasing weights over time.
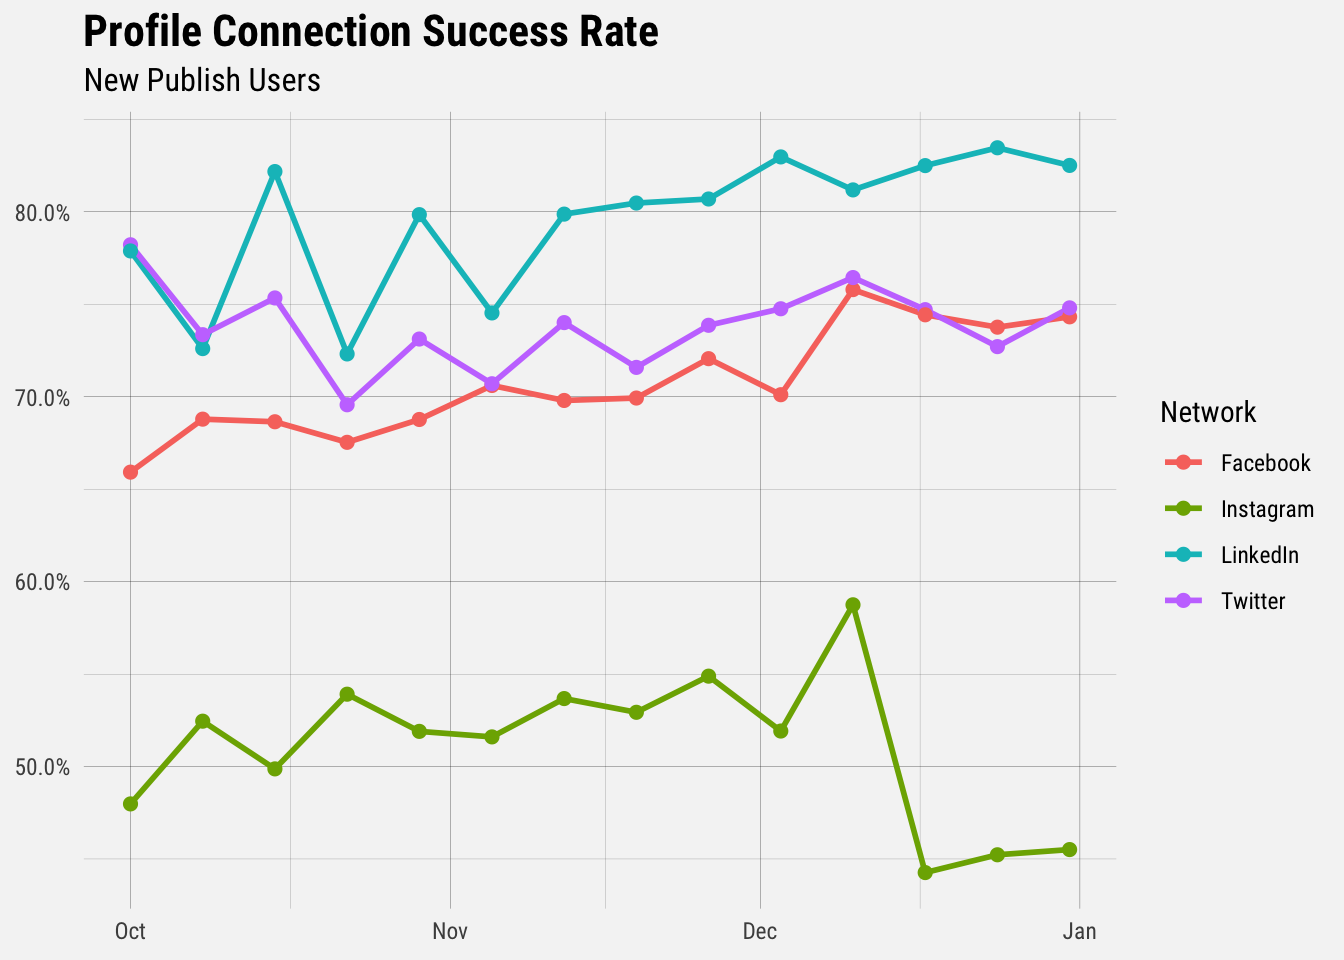
Instagram Profile Connection Rates
In a recent analysis we calculated the profile connection success rates. The connection rate of Instagram profiles is lower than we’d like, so we set a goal of improving the connection rate to 70% by the end of the month. You can view the recent profile connection success rates in this look. It’s currently around 48%, but improvements are coming in the next week!
Analysis of Instagram connection success rates.
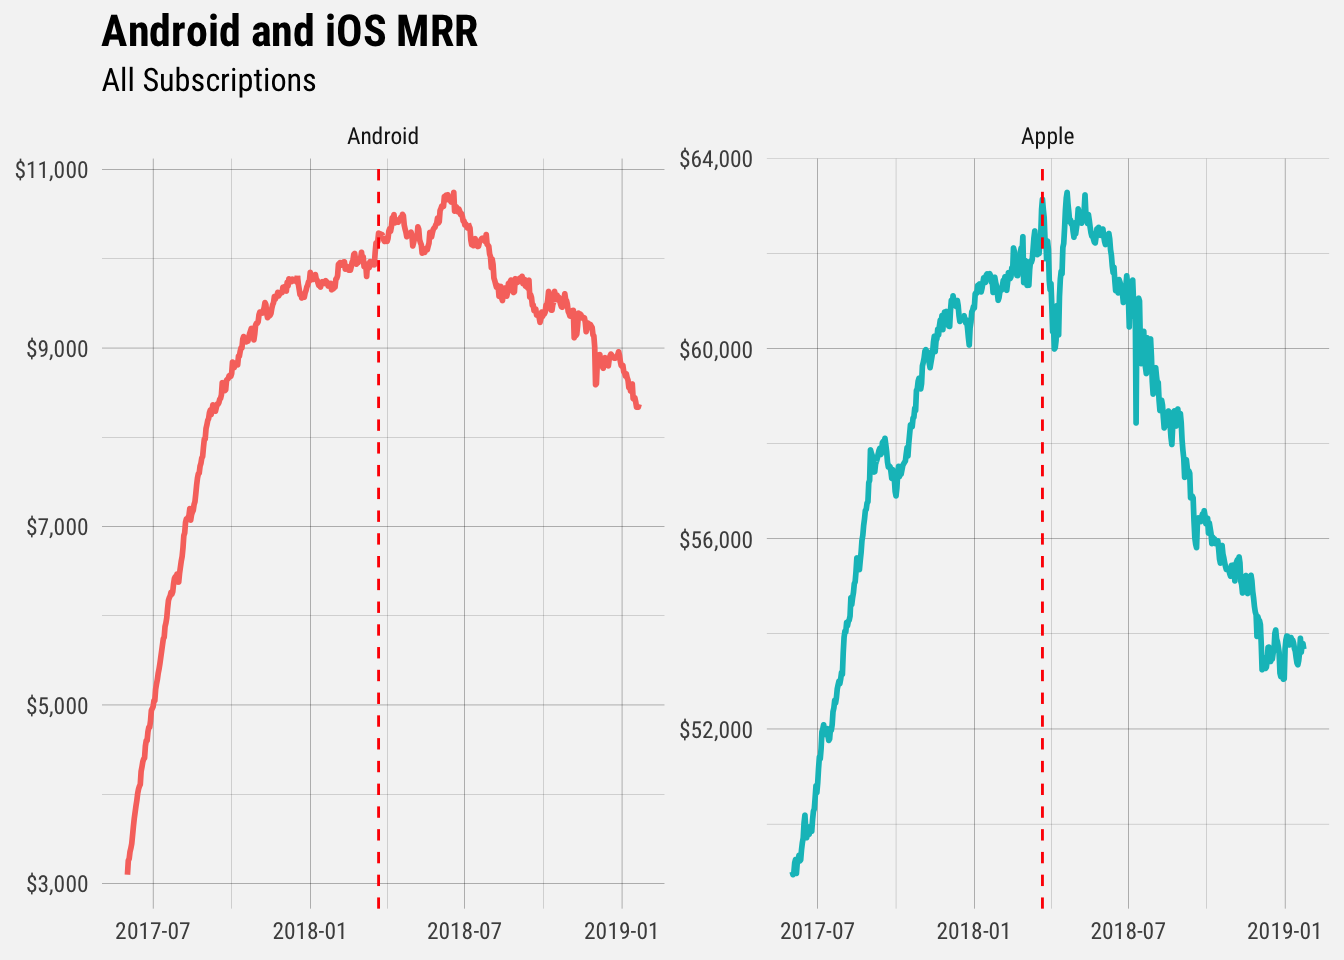
Effect of pro price change on mobile revenue
We may have underestimated the effect that the price change might have on mobile revenue. Full analysis is up on the data blog.
Effect of pro price change on mobile revenue
Predicting reach of Instagram posts with neural networks
We built this shiny app as a sort of MVP for an optimal timing tool for Analyze. There is still work to be done once we are more confident in the quality of our data. 🤓
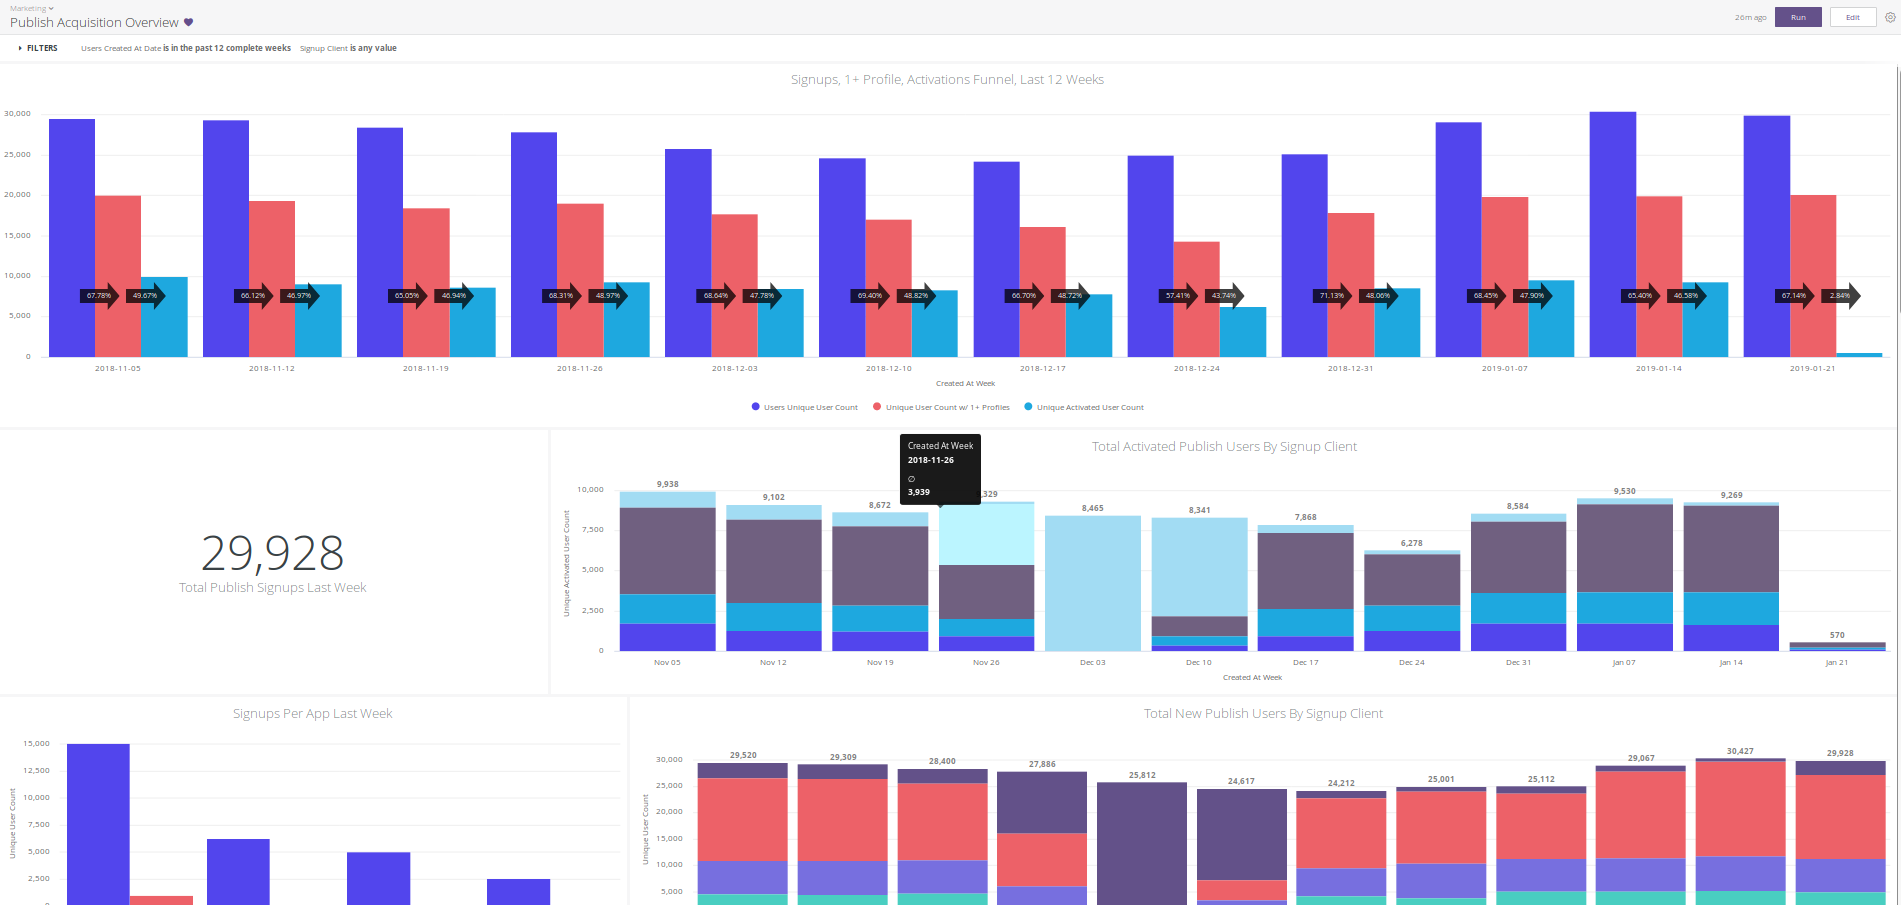
Follow the New Publish Rollout
To new users, and to existing free users.
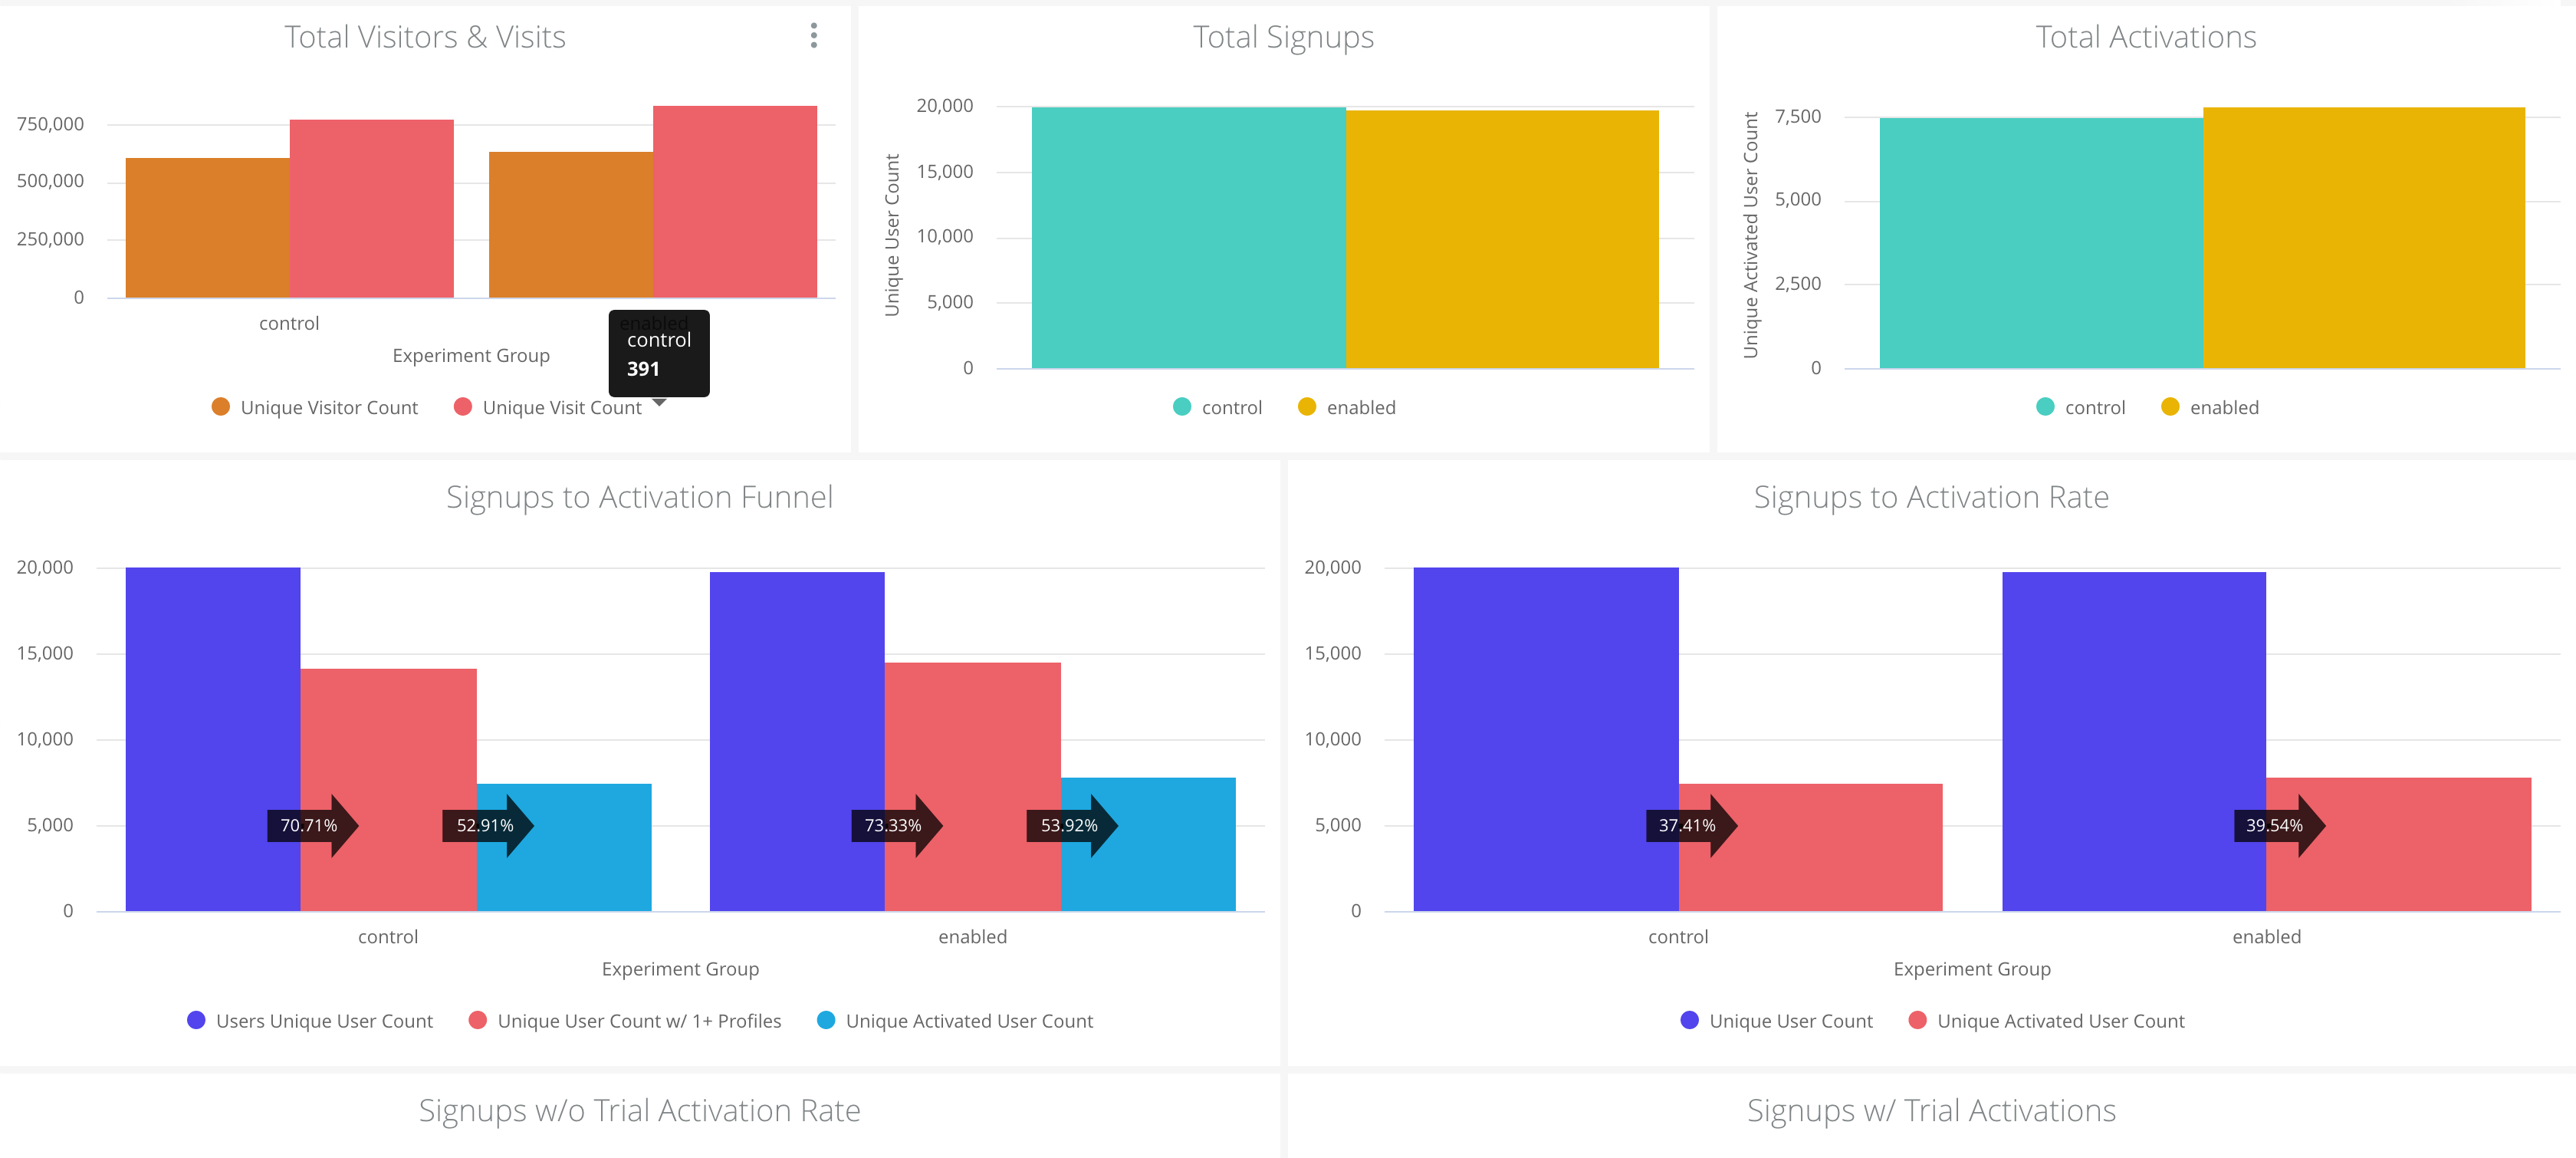
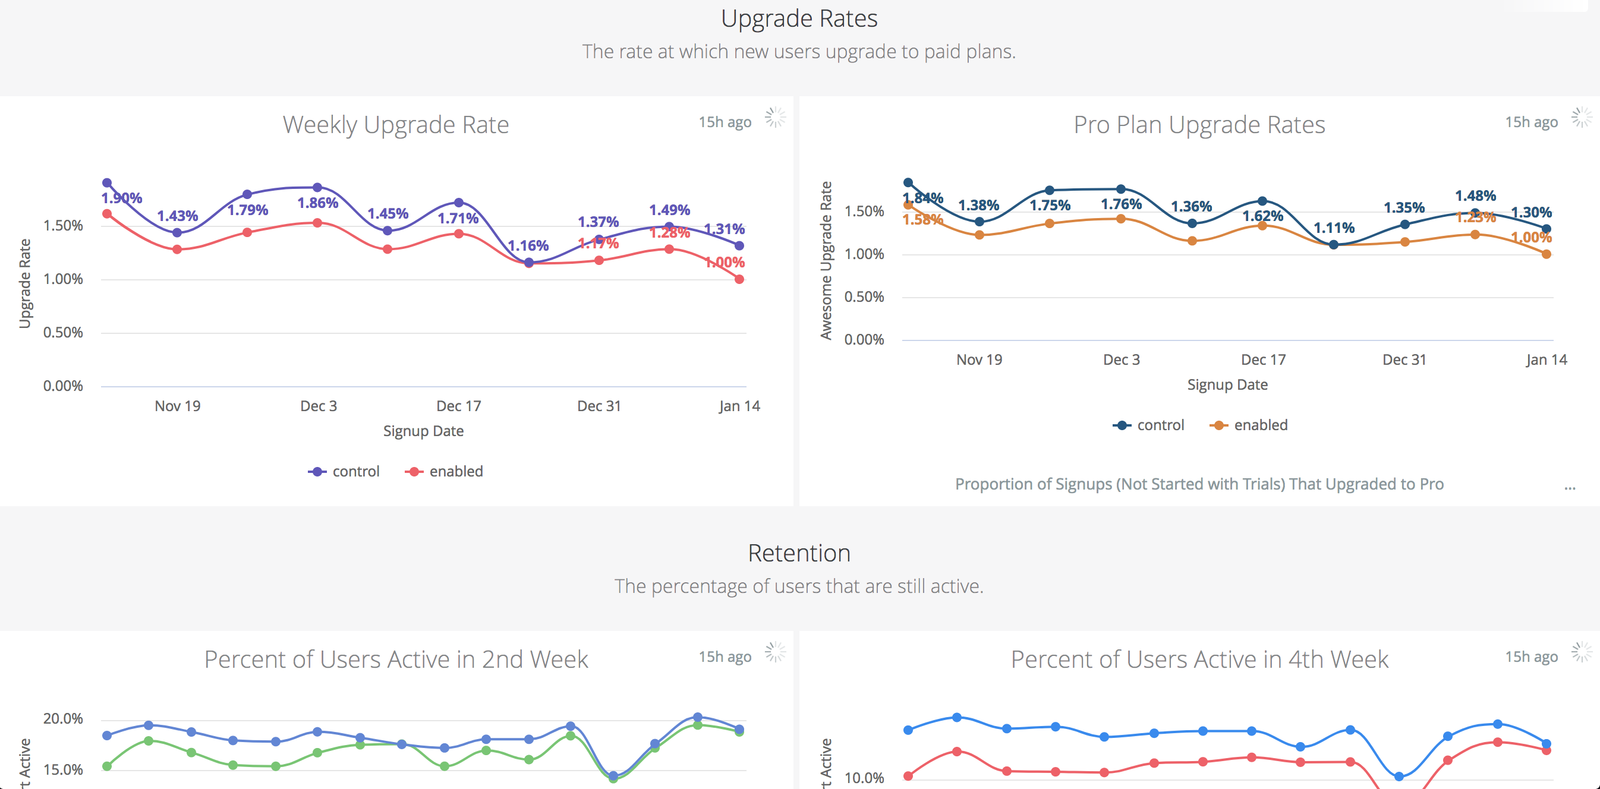
Experiment: Redirect signup CTAs to Pricing Page
We recently concluded an interesting experiment to move signup CTA’s on the buffer.com home page to buffer.com/pricing. Check out the results and tracking dashboards here.
Experiment: Redirect Homepage Signup CTAs to Pricing Page